Reading Graphs, Tables, and Charts
Authored by David Goodman
Biology, Science
9th - 12th Grade
CCSS covered
Used 178+ times

AI Actions
Add similar questions
Adjust reading levels
Convert to real-world scenario
Translate activity
More...
Content View
Student View
59 questions
Show all answers
1.
MULTIPLE CHOICE QUESTION
30 sec • 1 pt

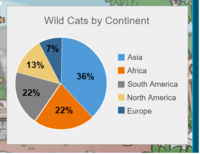
Which continent has 36% of the wild cats?
Asia
Africa
North America
South America
2.
MULTIPLE CHOICE QUESTION
30 sec • 1 pt

Which continent has 13% of wild cats?
Asia
Africa
North America
South America
3.
MULTIPLE CHOICE QUESTION
30 sec • 1 pt

Which Continent has the smallest % of wild cats?
Tags
CCSS.2.MD.D.9
4.
MULTIPLE CHOICE QUESTION
1 min • 1 pt

Which pizzeria has the second largest sales?
Tags
CCSS.5.NBT.A.3B
5.
MULTIPLE CHOICE QUESTION
1 min • 1 pt
What percentage does a whole pie chart represent?
360%
90%
50%
100%
6.
MULTIPLE CHOICE QUESTION
30 sec • 1 pt

Look at the bar graph, "Nicest Fruit". What does the y-axis show?
Types of fruit
Number of people.
Tags
CCSS.HSN.VM.C.6
7.
MULTIPLE CHOICE QUESTION
30 sec • 1 pt

Look at the bar graph, "Nicest Fruit". What does the x-axis show?
Types of fruit
The number of people.
Tags
CCSS.HSN.VM.C.6
Access all questions and much more by creating a free account
Create resources
Host any resource
Get auto-graded reports

Continue with Google

Continue with Email

Continue with Classlink

Continue with Clever
or continue with

Microsoft
%20(1).png)
Apple
Others
Already have an account?
Similar Resources on Wayground

54 questions
Motion / Forces Study Guide
Quiz
•
10th Grade

61 questions
2.1 biogeochemical cycles
Quiz
•
9th - 12th Grade

55 questions
Weathering, Erosion, Soil, Watersheds
Quiz
•
9th - 12th Grade

63 questions
BIO Invertebrate Test Review
Quiz
•
10th Grade

64 questions
Photosynthesis Review
Quiz
•
9th - 12th Grade

60 questions
Science 10_Reviewer 4thQ
Quiz
•
10th Grade

54 questions
Life Cycle of Stars
Quiz
•
7th - 10th Grade

58 questions
S2 Circuits Mid-unit Test
Quiz
•
8th - 10th Grade
Popular Resources on Wayground

7 questions
History of Valentine's Day
Interactive video
•
4th Grade

15 questions
Fractions on a Number Line
Quiz
•
3rd Grade

20 questions
Equivalent Fractions
Quiz
•
3rd Grade

25 questions
Multiplication Facts
Quiz
•
5th Grade

22 questions
fractions
Quiz
•
3rd Grade

15 questions
Valentine's Day Trivia
Quiz
•
3rd Grade

20 questions
Main Idea and Details
Quiz
•
5th Grade

20 questions
Context Clues
Quiz
•
6th Grade
Discover more resources for Biology

22 questions
Human Body Systems Overview
Quiz
•
9th Grade

25 questions
photosynthesis and cellular respiration
Quiz
•
9th Grade

15 questions
African American Impact in the 1980s
Quiz
•
9th Grade

20 questions
Symbiotic Relationships
Quiz
•
9th Grade

20 questions
Food Chains and Food Webs
Quiz
•
7th - 12th Grade

10 questions
Exploring Food Webs and Energy Pyramids
Interactive video
•
6th - 10th Grade

20 questions
Cladogram Practice
Quiz
•
10th Grade

20 questions
CFA #2 Unit 3 Human Body Systems (21.2 & 21.3)
Quiz
•
9th - 12th Grade


