EOC Practice part 2
Authored by Dayna White
Mathematics
8th - 12th Grade
CCSS covered
Used 48+ times

AI Actions
Add similar questions
Adjust reading levels
Convert to real-world scenario
Translate activity
More...
Content View
Student View
14 questions
Show all answers
1.
MULTIPLE CHOICE QUESTION
30 sec • 1 pt
A grill at a barbecue restaurant will be used to cook sausage links that are 2 lb each and briskets that are 6 lb each. No more than 120 lb of sausage links and briskets will be cooked on the grill.
Which inequality represents all possible combinations of x, the number of sausage links that will be cooked on the grill, and y, the number of briskets that will also be cooked?
Answer explanation
2.
MULTIPLE CHOICE QUESTION
30 sec • 1 pt
Which expression is equivalent to ?
Answer explanation
Tags
CCSS.HSA.APR.A.1
3.
MULTIPLE CHOICE QUESTION
30 sec • 1 pt
Which graph best represents the solution set of y > 3x - 4 ?
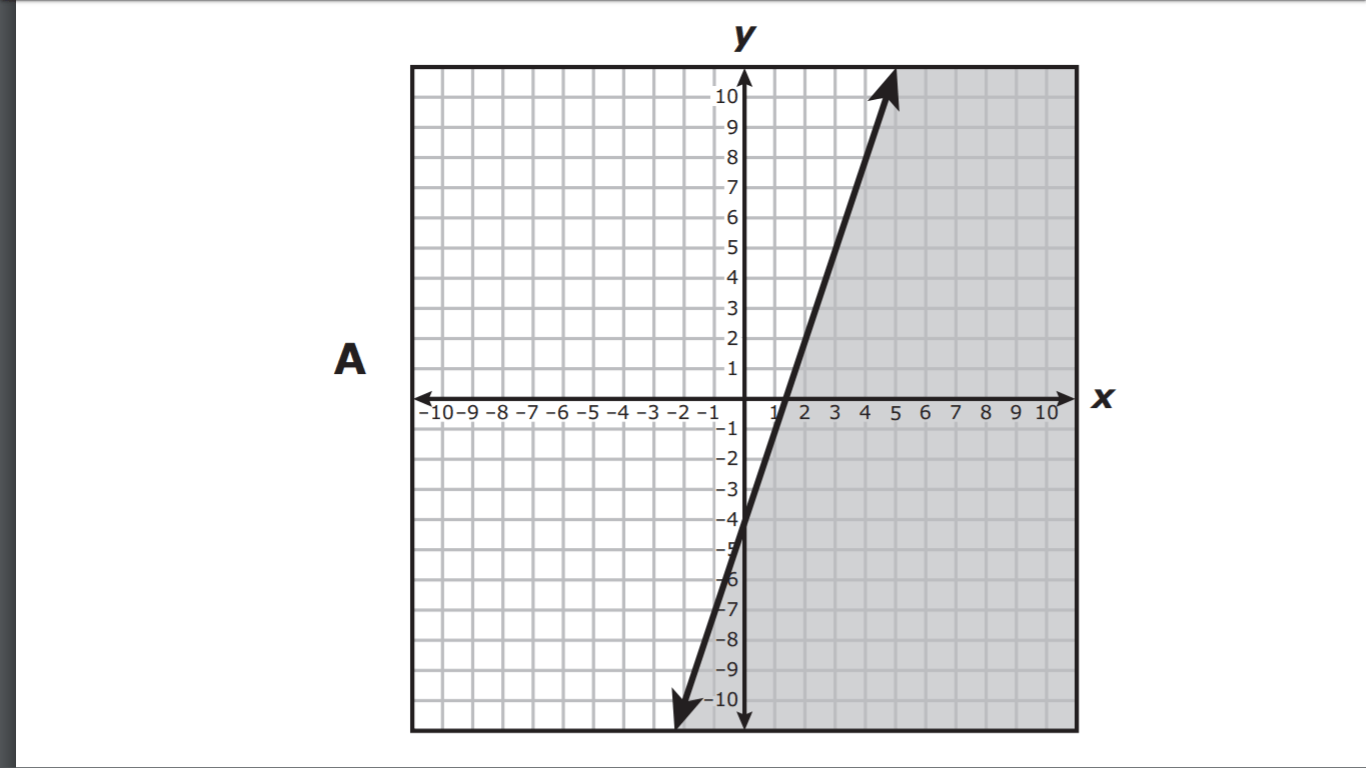
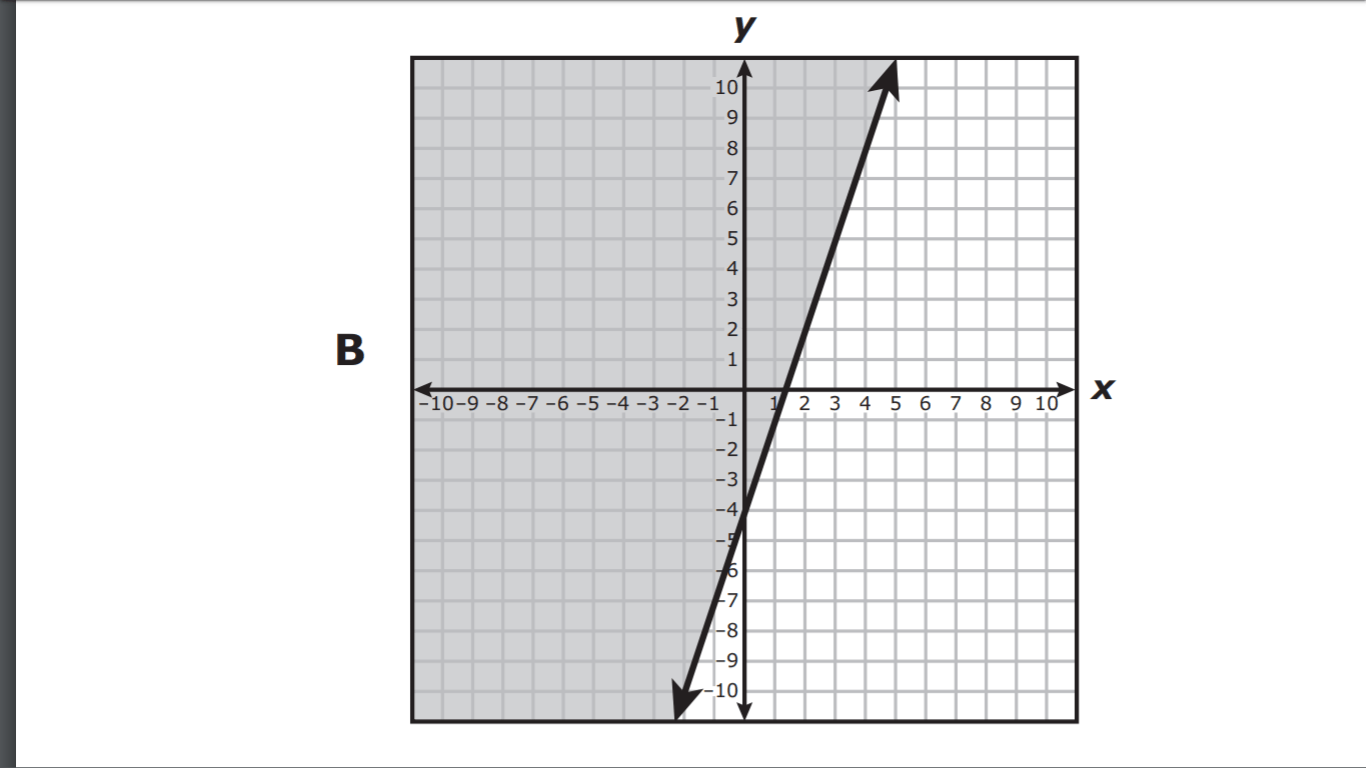
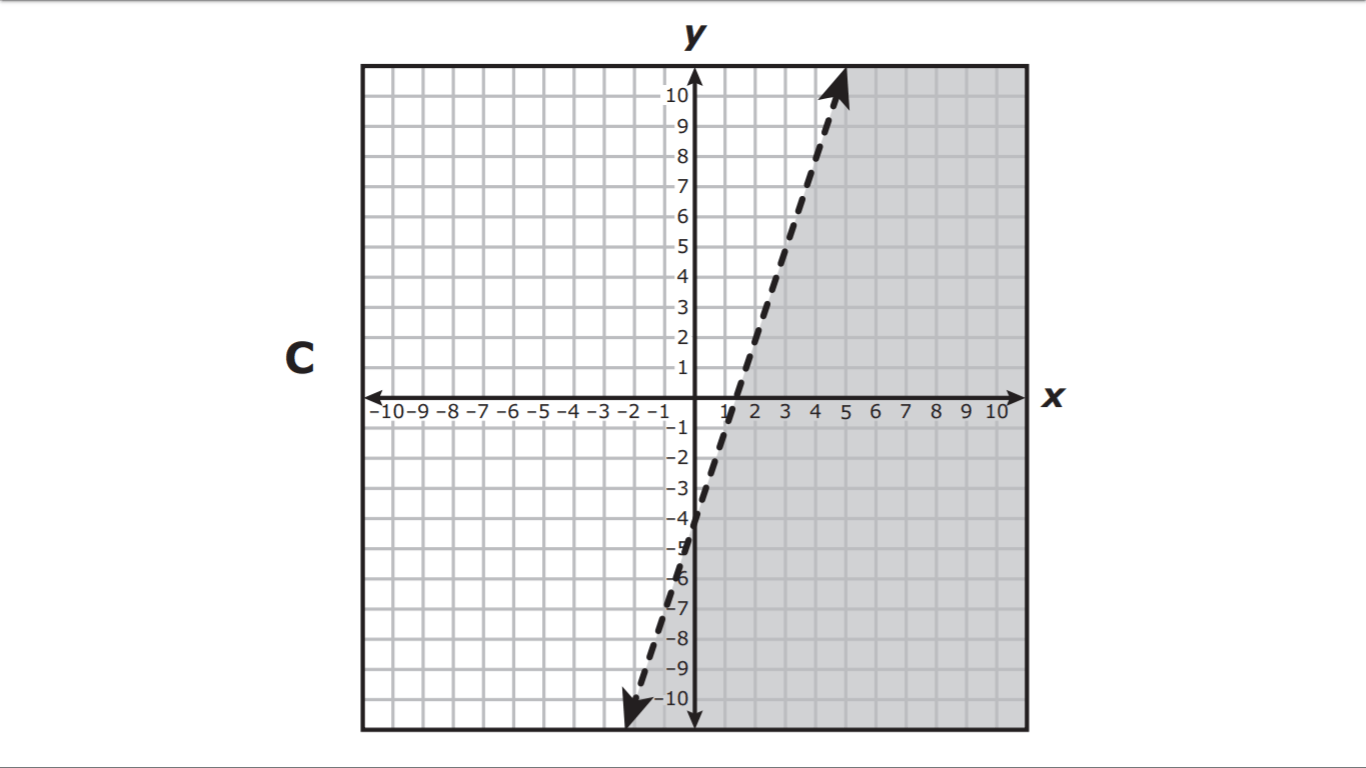
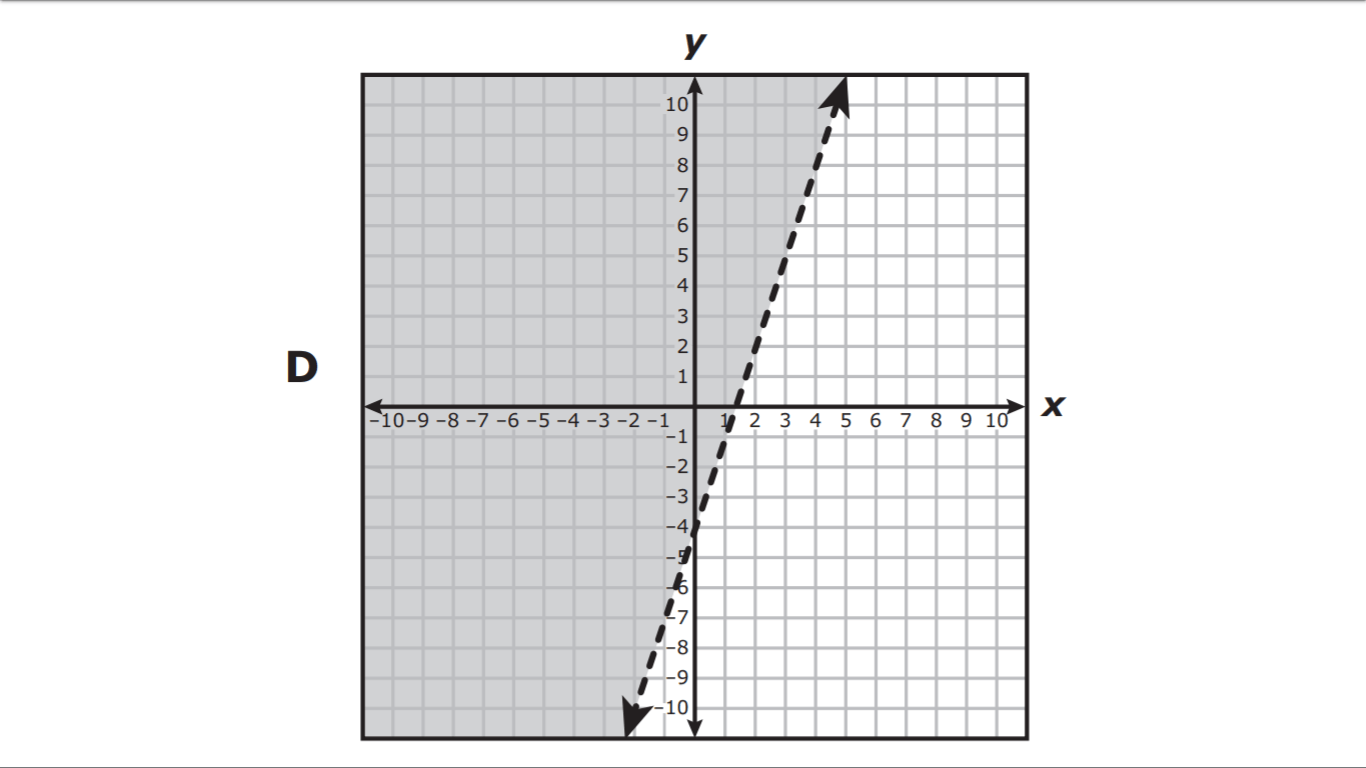
Answer explanation
Tags
CCSS.HSA.REI.D.12
4.
MULTIPLE CHOICE QUESTION
30 sec • 1 pt
A bank account earning annual compound interest was opened, and no additional deposits or withdrawals were made after the initial deposit. The balance in the account after x years can be modeled by .
Which statement is the best interpretation of one of the values in this function?
The initial balance of the account decreases at a rate of 97.5% each year.
The balance in the account increases at a rate of 2.5% each year.
The initial balance of the account was $1,025.
The balance in the account at the end of one year is $850.
Answer explanation

Tags
CCSS.HSF.LE.B.5
5.
MULTIPLE CHOICE QUESTION
30 sec • 1 pt

A company collected data for the number of text messages sent and received using a text-message application since October 2011. The table shows the number of text messages sent and received in billions over time. The data can be modeled by a quadratic function.
Which function best models the data?
Answer explanation
6.
FILL IN THE BLANK QUESTION
30 sec • 1 pt

The graph of a linear function is shown on the grid.
What is the rate of change of y with respect to x for this function?
(a)
Answer explanation
Tags
CCSS.8.F.B.4
CCSS.HSF.IF.B.6
7.
MULTIPLE CHOICE QUESTION
30 sec • 1 pt
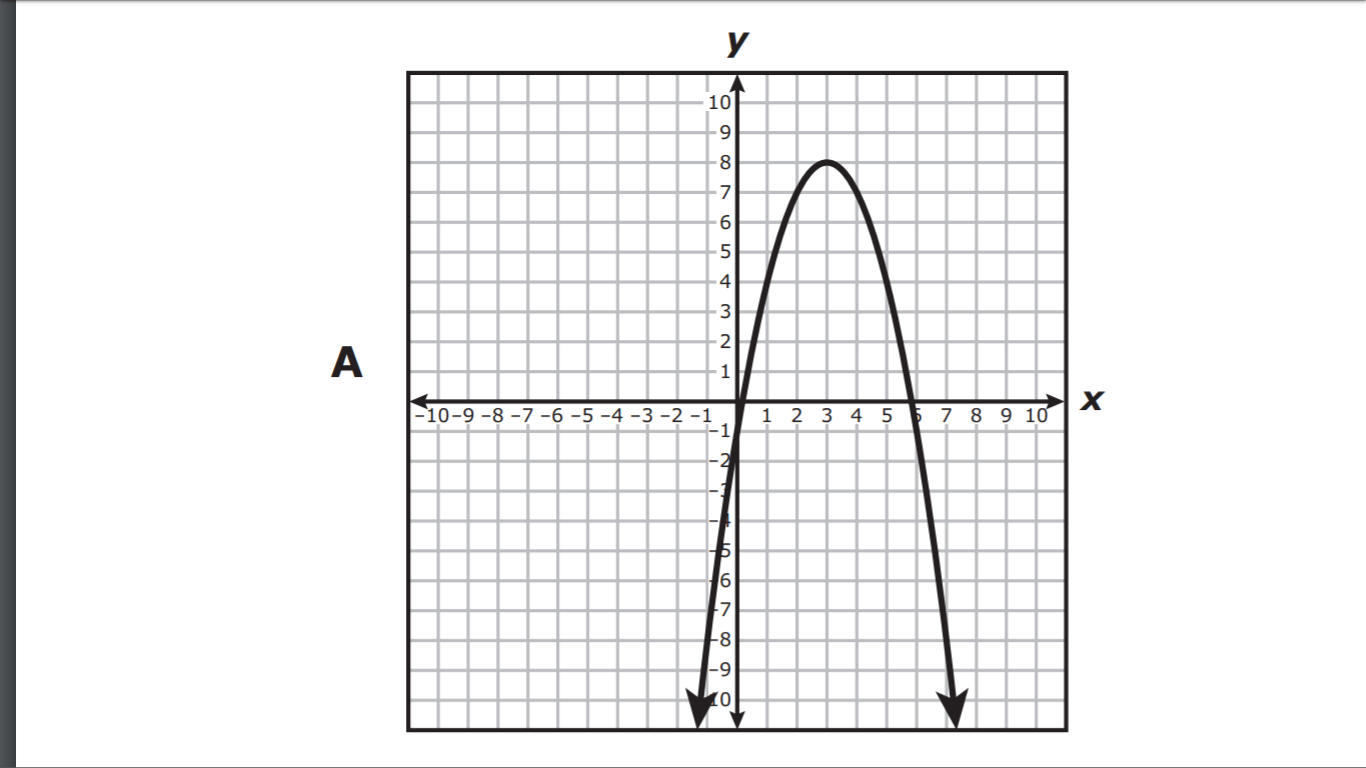
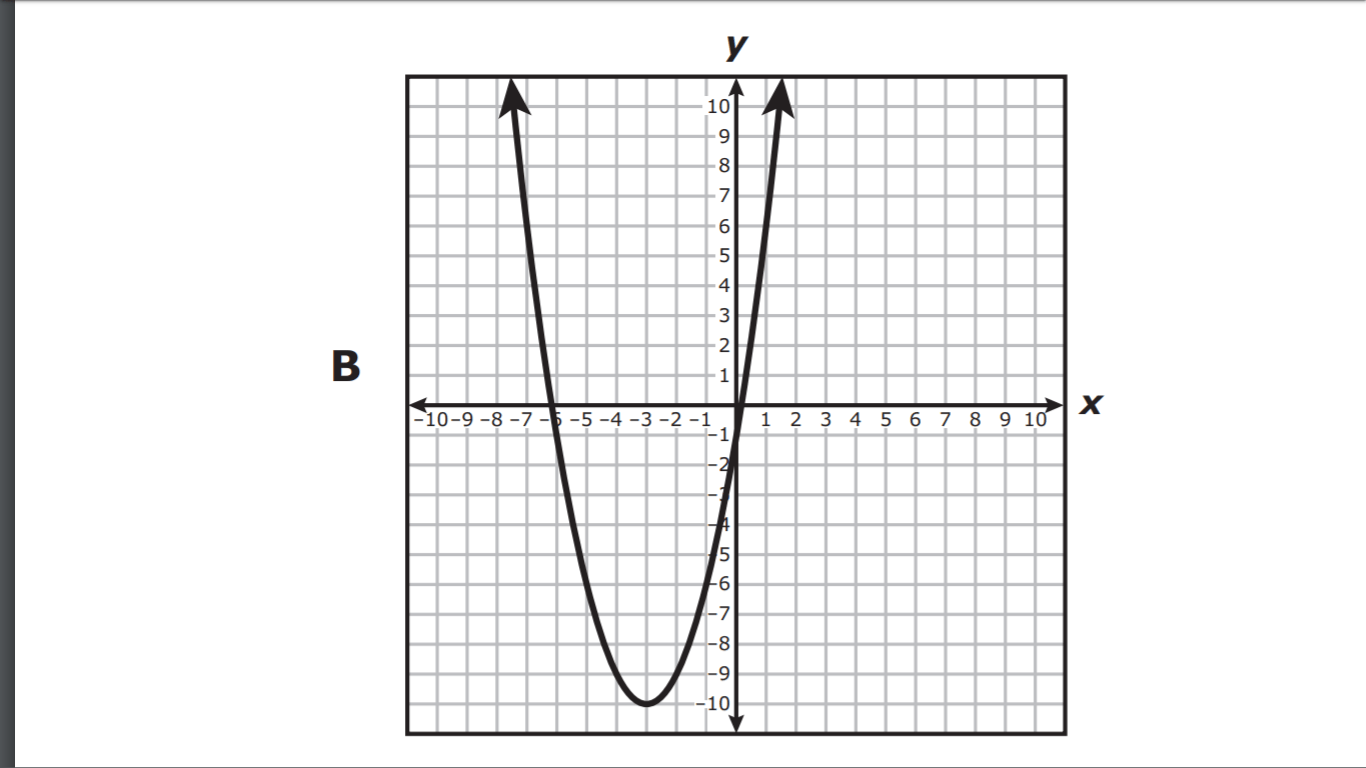
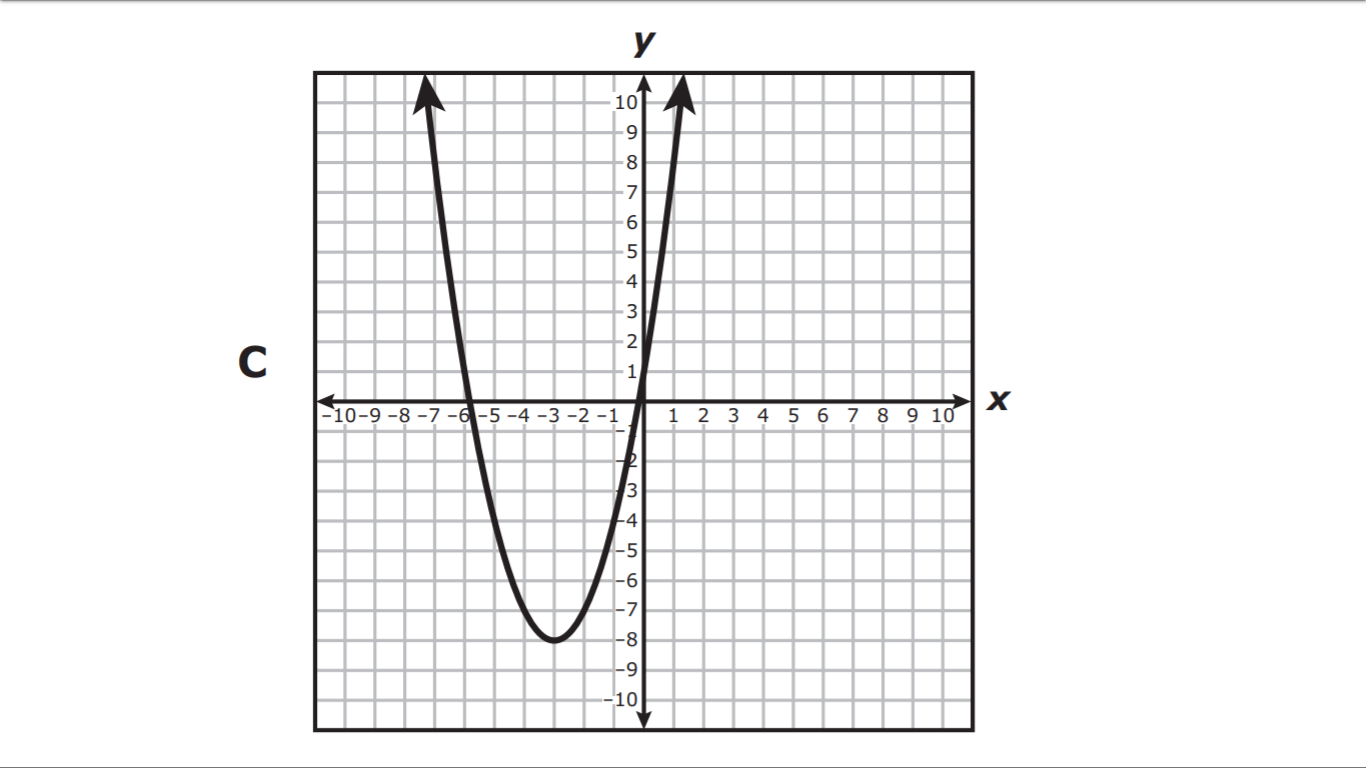
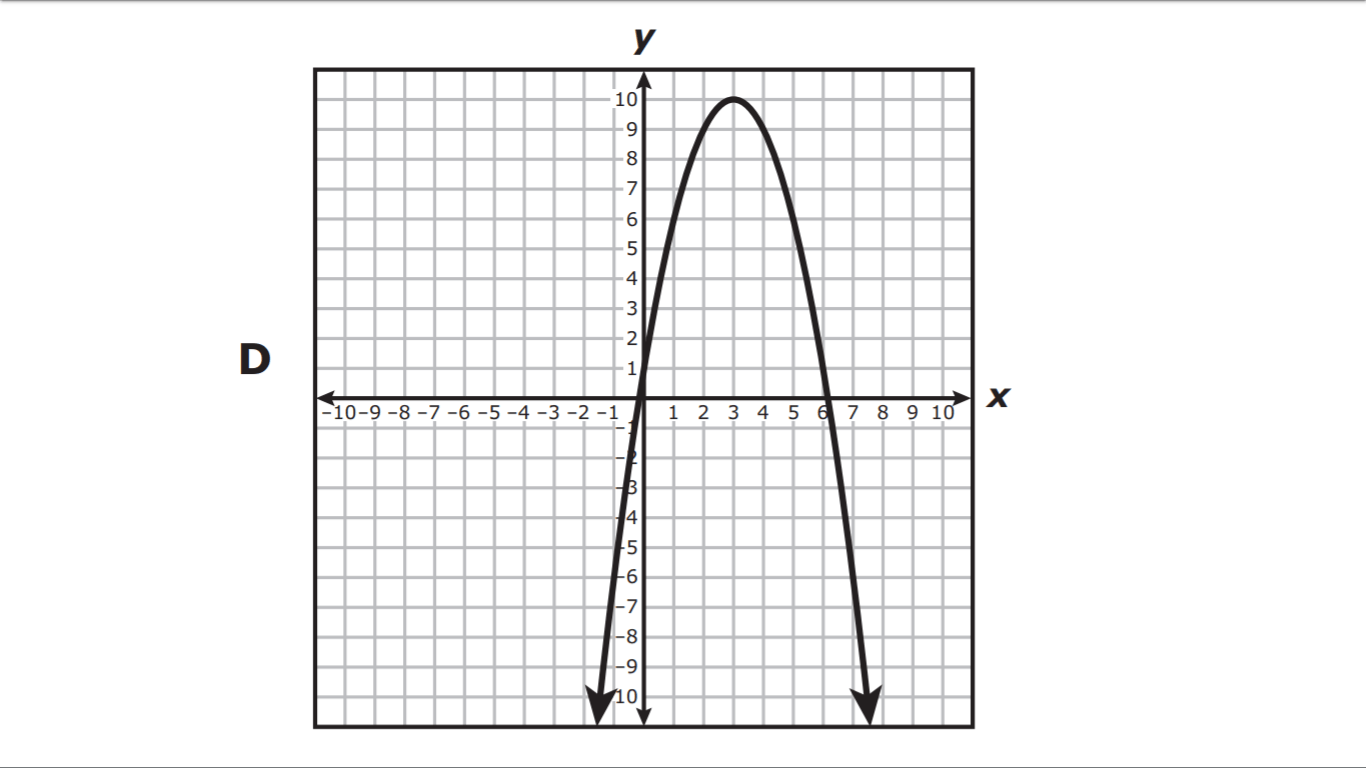
Which graph best represents ?
Answer explanation
Tags
CCSS.HSF-IF.C.7A


Access all questions and much more by creating a free account
Create resources
Host any resource
Get auto-graded reports
Continue with Google

Continue with Email
Continue with Classlink
Continue with Clever
or continue with
Microsoft
%20(1).png)
Apple
Others
Already have an account?
