
Data & Graphing
Authored by Lorissa Sarkisian
Mathematics
3rd Grade
CCSS covered
Used 930+ times


AI Actions
Add similar questions
Adjust reading levels
Convert to real-world scenario
Translate activity
More...
Content View
Student View
20 questions
Show all answers
1.
MULTIPLE CHOICE QUESTION
15 mins • 1 pt
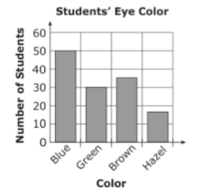
Miss Lee's science class collected data on the color of 3rd grade student's eyes. The students created a bar graph with this information. How many more students had blue eyes than green eyes?
80
50
30
20
Tags
CCSS.3.OA.D.8
2.
MULTIPLE CHOICE QUESTION
15 mins • 1 pt

The graph shows the number of cars sold from January to April. How many more cars were sold in March than in January?
2,000
5,000
7,000
8,000
Tags
CCSS.4.OA.A.3
3.
MULTIPLE CHOICE QUESTION
15 mins • 1 pt
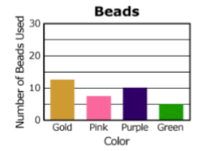
The graph shows the number of colored beads used to make a necklace. How many purple and green beads were used in all?
23
20
18
15
Tags
CCSS.3.OA.D.8
4.
MULTIPLE CHOICE QUESTION
15 mins • 1 pt

How many students like vanilla and chocolate?
Tags
CCSS.5.G.A.2
5.
MULTIPLE CHOICE QUESTION
15 mins • 1 pt
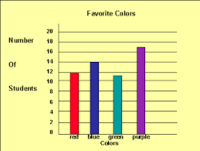
How many students' favorite color is blue?
Tags
CCSS.2.MD.D.9
6.
MULTIPLE CHOICE QUESTION
15 mins • 1 pt

How many people had 3 pets?
Tags
CCSS.4.MD.B.4
7.
MULTIPLE CHOICE QUESTION
15 mins • 1 pt

How many cars were sold on Saturday and Sunday?
Tags
CCSS.3.OA.D.8


Access all questions and much more by creating a free account
Create resources
Host any resource
Get auto-graded reports

Continue with Google

Continue with Email

Continue with Microsoft
or continue with

%20(1).png)
Apple

Others
By signing up, you agree to our Terms of Service & Privacy Policy
Already have an account?



