
Graphing Linear Equations
7th - 9th Grade
•10 Qs

Similar activities
Prueba Inicial Ecuaciones 1º grado
8th Grade
•10 Qs
Omjeri
8th - 12th Grade
•10 Qs
M8 - AddSub RatExp FormQuiz
8th Grade
•10 Qs
المستطيل - رياضيات 2
3rd - 12th Grade
•15 Qs
Diagnosis. Física 3er año.
9th Grade
•10 Qs
MAT semestr 3B - Sumy algebraiczne
8th - 10th Grade
•10 Qs
1° Bimestre
6th - 8th Grade
•10 Qs
Reto semana 2
1st - 10th Grade
•11 Qs

Graphing Linear Equations
Quiz
•
Mathematics
•
7th - 9th Grade
•
Practice Problem
•
Medium
+5
Standards-aligned

Karen Duran
Used 136+ times
FREE Resource
Enhance your content in a minute
10 questions
Show all answers
1.
MULTIPLE CHOICE QUESTION
3 mins • 1 pt

What is the y-intercept of the line?
Tags
CCSS.8.EE.B.6
CCSS.8.F.A.3
CCSS.8.F.B.4
2.
MULTIPLE CHOICE QUESTION
1 min • 1 pt
The point where the line crosses the y-axis is called the:
Tags
CCSS.8.F.A.3
CCSS.8.F.B.4
3.
MULTIPLE CHOICE QUESTION
3 mins • 1 pt

What is the x- intercept of the line?
Tags
CCSS.8.EE.B.6
CCSS.8.EE.C.7
CCSS.8.F.A.3
CCSS.8.F.B.4
4.
MULTIPLE CHOICE QUESTION
5 mins • 1 pt
Given the list of ordered pairs, what is the x-intercept?
(8,10), (3, -4), (0, 8), (4, -3), (9, 0)
Tags
CCSS.8.F.A.1
CCSS.8.F.A.3
CCSS.8.F.B.5
CCSS.8.SP.A.3
5.
MULTIPLE CHOICE QUESTION
1 min • 1 pt
In the following equation, what is the y-intercept?
y = -3x + 7
Tags
CCSS.8.EE.B.6
CCSS.8.F.A.3
6.
MULTIPLE CHOICE QUESTION
30 sec • 1 pt

Which graph represents the table?


Tags
CCSS.8.EE.B.5
7.
MULTIPLE CHOICE QUESTION
30 sec • 1 pt
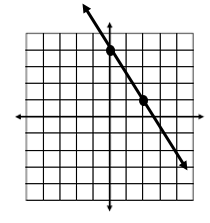
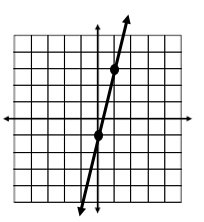
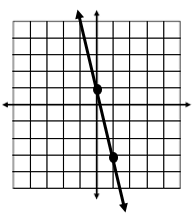
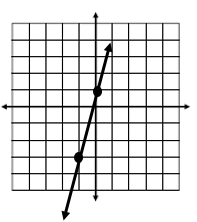
Which graph represents the equation
Tags
CCSS.8.F.A.3
CCSS.8.F.B.4
CCSS.8.F.B.5
CCSS.8.SP.A.3


Access all questions and much more by creating a free account
Create resources
Host any resource
Get auto-graded reports
Continue with Google

Continue with Email
Continue with Classlink
Continue with Clever
or continue with
Microsoft
%20(1).png)
Apple
Others
Already have an account?
Similar Resources on Wayground
13 questions
Kvadrātfunkcijas
Quiz
•
9th Grade
11 questions
SOAL SEGIEMPAT DAN SEGITIGA 2 KELAS 7
Quiz
•
7th Grade
10 questions
TOÁN LỚP 2
Quiz
•
7th - 12th Grade
15 questions
Valószínűségszámítás
Quiz
•
8th Grade
10 questions
Cuentas de Contabilidad
Quiz
•
9th Grade
10 questions
Revisões
Quiz
•
8th Grade - University
12 questions
surface area and volume of prisms
Quiz
•
8th - 12th Grade
10 questions
PROBLEMAS DE FRACCIONES 1ºESO (BURGOS)
Quiz
•
7th Grade
Popular Resources on Wayground
15 questions
Fractions on a Number Line
Quiz
•
3rd Grade
20 questions
Equivalent Fractions
Quiz
•
3rd Grade
25 questions
Multiplication Facts
Quiz
•
5th Grade
22 questions
fractions
Quiz
•
3rd Grade
20 questions
Main Idea and Details
Quiz
•
5th Grade
20 questions
Context Clues
Quiz
•
6th Grade
15 questions
Equivalent Fractions
Quiz
•
4th Grade
20 questions
Figurative Language Review
Quiz
•
6th Grade
Discover more resources for Mathematics
22 questions
distributive property
Quiz
•
7th Grade
15 questions
Product of Powers Property A1 U7
Quiz
•
8th Grade
20 questions
Laws of Exponents
Quiz
•
8th Grade
16 questions
8th U5L5 Graphs of Functions
Quiz
•
8th Grade
20 questions
Graphing Inequalities on a Number Line
Quiz
•
6th - 9th Grade
16 questions
Adding and Subtracting Integers
Quiz
•
7th Grade
12 questions
Exponential Growth and Decay
Quiz
•
9th Grade
20 questions
Exponent Rules Review
Quiz
•
8th - 9th Grade