4-10 Quadratic Inequalities
Authored by Kimberly Cline
Mathematics
9th - 12th Grade
CCSS covered
Used 15+ times

AI Actions
Add similar questions
Adjust reading levels
Convert to real-world scenario
Translate activity
More...
Content View
Student View
10 questions
Show all answers
1.
MULTIPLE CHOICE QUESTION
2 mins • 1 pt

y < x2 - 4x + 4
y ≤ x2 + 4x + 4
y ≥ x2 + 4x + 4
y > x2 - 4x + 4
Tags
CCSS.HSA.REI.D.12
2.
MULTIPLE CHOICE QUESTION
2 mins • 1 pt

y ≥ -x2 - 8x -15
y < -x2 + 8x - 15
y ≤ x2 - 8x + 17
y ≤ -x2 + 8x - 15
Tags
CCSS.HSF-IF.C.7A
3.
MULTIPLE CHOICE QUESTION
30 sec • 1 pt
When you graph an inequality, you use a closed dot when you use which symbols?
<, >
≤, ≥
≤, <
≥, >
Tags
CCSS.6.EE.B.8
4.
MULTIPLE CHOICE QUESTION
30 sec • 1 pt
When graphing an inequality, you use an open dot when you use which symbol?
Tags
CCSS.6.EE.B.8
5.
MULTIPLE CHOICE QUESTION
30 sec • 1 pt
Which graph matches the inequality


Tags
CCSS.HSA.REI.D.12
6.
MULTIPLE CHOICE QUESTION
30 sec • 1 pt
Which graph matches the inequality


Tags
CCSS.HSA.APR.B.3
CCSS.HSA.REI.B.4
CCSS.HSA.REI.C.7
7.
MULTIPLE CHOICE QUESTION
5 mins • 1 pt
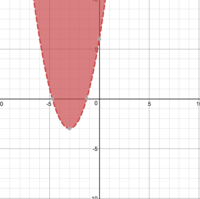
Which inequality is represented by the graph?
y > (x - 3)² - 3
y ≥ (x + 3)² - 3
y > (x + 3)² - 3
y ≥ (x - 3)² - 3
Tags
CCSS.HSF-IF.C.7A


Access all questions and much more by creating a free account
Create resources
Host any resource
Get auto-graded reports
Continue with Google

Continue with Email
Continue with Classlink
Continue with Clever
or continue with
Microsoft
%20(1).png)
Apple
Others
Already have an account?
