8th Grade Unit 6 Review
Authored by Jinsi Shu
Mathematics
8th Grade
CCSS covered
Used 4+ times

AI Actions
Add similar questions
Adjust reading levels
Convert to real-world scenario
Translate activity
More...
Content View
Student View
10 questions
Show all answers
1.
MULTIPLE CHOICE QUESTION
30 sec • 1 pt

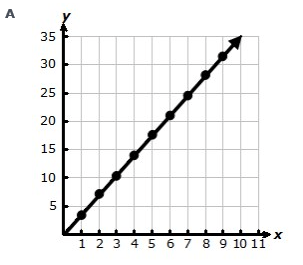
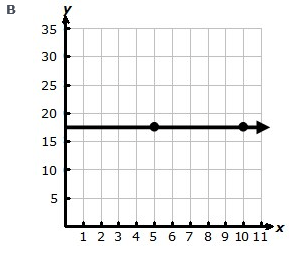
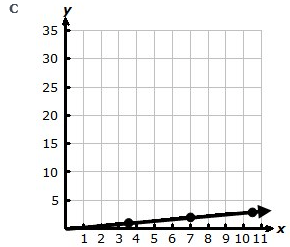
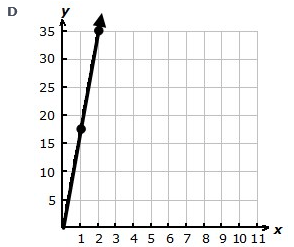
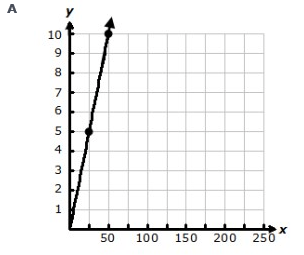
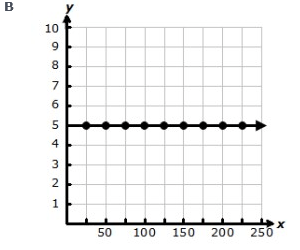
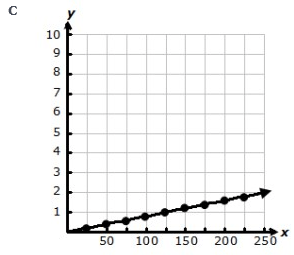
Which function (or equation) best represents the relationship in the graph?
Tags
CCSS.8.F.B.4
CCSS.HSF.LE.A.2
2.
MULTIPLE CHOICE QUESTION
30 sec • 1 pt
Melissa is saving the $30 she earned for washing her mom's car. She earns $10 every week for doing other chores, which she also saves. Which equation represents the amount of money Melissa will have after x weeks.
Tags
CCSS.6.EE.C.9
3.
MULTIPLE CHOICE QUESTION
30 sec • 1 pt

Which equation can be used to describe the relationship between x and y in the graph?
Tags
CCSS.8.F.B.4
CCSS.HSF.LE.A.2
4.
MULTIPLE CHOICE QUESTION
30 sec • 1 pt

Based on the scatterplot, what is the best prediction of the resting heart rate, in beats per minute, of a person who exercises an average of 8 hours each week?
5.
MULTIPLE CHOICE QUESTION
30 sec • 1 pt

Based on the scatterplot, what is the best prediction of the average number of hours a person spends at work every week if that person spends an average of 10 hours on recreational activities every week?
6.
MULTIPLE CHOICE QUESTION
2 mins • 1 pt

Based on the scatterplot, what is the best prediction of the average amount of money spent on groceries for a household of 7 people?
Tags
CCSS.6.SP.A.1
CCSS.6.SP.A.2
CCSS.6.SP.A.3
CCSS.6.SP.B.4
CCSS.6.SP.B.5
7.
MULTIPLE CHOICE QUESTION
30 sec • 1 pt

Phil collected data from several of his friends about the number of hours they spent sleeping and the number of hours they spent playing video games on Saturday. He recorded the data in the scatterplot. Based on the scatterplot, what is the best prediction of the number of hours one of Phil's friends spends sleeping when the friend spends 1 hour playing video games?
9 hours
10 hours
7 hours
8 hours
Tags
CCSS.6.EE.C.9
CCSS.6.SP.A.1
CCSS.6.SP.A.2
CCSS.6.SP.A.3
CCSS.6.SP.B.4
CCSS.6.SP.B.5


Access all questions and much more by creating a free account
Create resources
Host any resource
Get auto-graded reports
Continue with Google

Continue with Email
Continue with Classlink
Continue with Clever
or continue with
Microsoft
%20(1).png)
Apple
Others
Already have an account?
Similar Resources on Wayground

11 questions
Planteo de Ecuaciones
Quiz
•
1st - 10th Grade
10 questions
2nd Form Consumer Arithmetic
Quiz
•
8th Grade
10 questions
Evaluating Expressions
Quiz
•
8th Grade
15 questions
Conocimientos Previos
Quiz
•
5th - 10th Grade
10 questions
Proportionality
Quiz
•
7th - 8th Grade
10 questions
Kruse's Pythagorean and Its Converse
Quiz
•
8th Grade
15 questions
Supplementary angles
Quiz
•
7th - 11th Grade
13 questions
Evaluación #1 de matemáticas
Quiz
•
8th - 10th Grade
Popular Resources on Wayground
15 questions
Fractions on a Number Line
Quiz
•
3rd Grade
20 questions
Equivalent Fractions
Quiz
•
3rd Grade
25 questions
Multiplication Facts
Quiz
•
5th Grade
29 questions
Alg. 1 Section 5.1 Coordinate Plane
Quiz
•
9th Grade
22 questions
fractions
Quiz
•
3rd Grade
11 questions
FOREST Effective communication
Lesson
•
KG
20 questions
Main Idea and Details
Quiz
•
5th Grade
20 questions
Context Clues
Quiz
•
6th Grade
Discover more resources for Mathematics
14 questions
finding slope from a graph
Quiz
•
8th Grade
20 questions
Graphing Inequalities on a Number Line
Quiz
•
6th - 9th Grade
8 questions
8th U6L1: Organizing Data
Quiz
•
8th Grade
20 questions
Slope from a Graph
Quiz
•
8th Grade
12 questions
8th U5 Test Review: Functions & Volume
Quiz
•
8th Grade
20 questions
Slope Intercept Form
Quiz
•
7th - 8th Grade
20 questions
Angle Relationships
Quiz
•
6th - 8th Grade
14 questions
Estimate and Classify Real Numbers
Quiz
•
8th Grade