Tree Diagram/Tables Practice
Authored by Heidi Evans
Mathematics
7th Grade
CCSS covered
Used 59+ times

AI Actions
Add similar questions
Adjust reading levels
Convert to real-world scenario
Translate activity
More...
Content View
Student View
10 questions
Show all answers
1.
MULTIPLE CHOICE QUESTION
2 mins • 1 pt
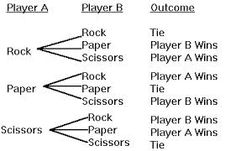
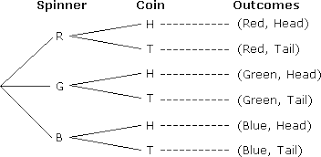
A tree diagram is useful in determining the __________of a probability experiment.
result
possible outcomes
event
none of the above
Tags
CCSS.HSS.CP.A.1
2.
MULTIPLE CHOICE QUESTION
5 mins • 1 pt

How many total outfit options are represented?
Tags
CCSS.3.OA.A.3
3.
MULTIPLE CHOICE QUESTION
2 mins • 1 pt
You have a 3 tops, 2 pants and 2 shoes. How many total outfit options are represented?
12 outfits
22 outfits
3 outfits
7 outfits
Tags
CCSS.3.OA.A.3
4.
MULTIPLE CHOICE QUESTION
3 mins • 1 pt
Which tree diagram has the most possible outcomes?
Tags
CCSS.HSS.CP.B.9
5.
MULTIPLE CHOICE QUESTION
2 mins • 1 pt

What is the probability you select a person who would pick chocolate?
Tags
CCSS.HSS.CP.A.1
CCSS.HSS.ID.B.5
CCSS.HSS.IC.A.1
CCSS.HSS.IC.B.4
6.
MULTIPLE CHOICE QUESTION
2 mins • 1 pt

How many total people were surveyed about what ice cream flavor they would pick?
Tags
CCSS.HSN.VM.C.6
7.
MULTIPLE CHOICE QUESTION
2 mins • 1 pt

What is the probability you choose a child that likes Vanilla?
Tags
CCSS.HSS.ID.B.5
CCSS.HSS.CP.A.3
CCSS.HSS.CP.A.4
CCSS.HSS.CP.B.6


Access all questions and much more by creating a free account
Create resources
Host any resource
Get auto-graded reports
Continue with Google

Continue with Email
Continue with Microsoft
or continue with

%20(1).png)
Apple
Others
Already have an account?
