3rd Grade Pie Graphs Quiz
Authored by Shelly Davis
Mathematics
1st - 3rd Grade
CCSS covered
Used 216+ times

AI Actions
Add similar questions
Adjust reading levels
Convert to real-world scenario
Translate activity
More...
Content View
Student View
12 questions
Show all answers
1.
MULTIPLE CHOICE QUESTION
30 sec • 1 pt

What type of graph is shown?
pictograph
stem and leaf
pie chart
histogram
Tags
CCSS.4.MD.B.4
2.
MULTIPLE CHOICE QUESTION
3 mins • 1 pt

According to this circle graph, what is the least popular flavor of Jolly Rancher?
Tags
CCSS.2.MD.D.9
3.
MULTIPLE CHOICE QUESTION
30 sec • 1 pt
What is the total percent of a pie or circle graph?
Tags
CCSS.7.EE.B.3
CCSS.3.OA.D.8
CCSS.4.OA.A.3
4.
MULTIPLE CHOICE QUESTION
30 sec • 1 pt

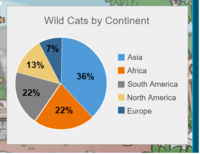
Which Continent is home to 36% of the wild cats?
Tags
CCSS.7.RP.A.3
5.
MULTIPLE CHOICE QUESTION
30 sec • 1 pt

What data is this pie graph showing?
Number of pets
Friendship Bracelet Sales
Favorite Pizza Topping
Timothy's Bug Bites
Tags
CCSS.3.MD.B.3
6.
MULTIPLE CHOICE QUESTION
30 sec • 1 pt

What Superhero got the least amout of votes?
Superman
Thor
The Hulk
Iron Man
Tags
CCSS.6.SP.A.1
CCSS.6.SP.A.2
CCSS.6.SP.B.5
7.
MULTIPLE CHOICE QUESTION
45 sec • 1 pt
What is a Pie Graph?
A graph that uses pictures of pie to display data.
A graph that uses bars to display data
A graph that is shaped like a circle to display data
Tags
CCSS.6.SP.B.4
Access all questions and much more by creating a free account
Create resources
Host any resource
Get auto-graded reports

Continue with Google

Continue with Email

Continue with Classlink

Continue with Clever
or continue with

Microsoft
%20(1).png)
Apple
Others
Already have an account?
Similar Resources on Wayground

10 questions
FRACTION
Quiz
•
3rd Grade

10 questions
Comparing Fractions
Quiz
•
3rd Grade

10 questions
CLASS-III MATHS FRACTION DT 20.01.2021
Quiz
•
3rd Grade

10 questions
Fractions of a Number
Quiz
•
3rd - 4th Grade

10 questions
Place Value and Rounding
Quiz
•
3rd - 4th Grade

10 questions
Place Value: Rounding Numbers to the Nearest Ten (3rd Grade)
Quiz
•
3rd Grade

10 questions
Telling Time using Digital Clock
Quiz
•
KG - 1st Grade

10 questions
Numbers in Words and in Symbols
Quiz
•
1st Grade
Popular Resources on Wayground

7 questions
History of Valentine's Day
Interactive video
•
4th Grade

15 questions
Fractions on a Number Line
Quiz
•
3rd Grade

20 questions
Equivalent Fractions
Quiz
•
3rd Grade

25 questions
Multiplication Facts
Quiz
•
5th Grade

22 questions
fractions
Quiz
•
3rd Grade

15 questions
Valentine's Day Trivia
Quiz
•
3rd Grade

20 questions
Main Idea and Details
Quiz
•
5th Grade

20 questions
Context Clues
Quiz
•
6th Grade
Discover more resources for Mathematics

15 questions
Fractions on a Number Line
Quiz
•
3rd Grade

20 questions
Equivalent Fractions
Quiz
•
3rd Grade

22 questions
fractions
Quiz
•
3rd Grade

18 questions
Comparing Fractions with same numerator or denominator
Quiz
•
3rd Grade

10 questions
Area
Quiz
•
3rd Grade

20 questions
Telling Time to the Hour and Half hour
Quiz
•
1st Grade

14 questions
Basic Fractions on a Number Line
Quiz
•
3rd Grade

20 questions
multiplication and division facts
Quiz
•
3rd Grade
