Bar Graphs for 5th Grade
Authored by Tina Crabb
Mathematics
4th - 5th Grade
CCSS covered
Used 166+ times

AI Actions
Add similar questions
Adjust reading levels
Convert to real-world scenario
Translate activity
More...
Content View
Student View
10 questions
Show all answers
1.
MULTIPLE CHOICE QUESTION
2 mins • 1 pt

Look at the bar graph, "Nicest Fruit". What does the x-axis show?
Types of fruit
The number of people.
Tags
CCSS.HSN.VM.C.6
2.
MULTIPLE CHOICE QUESTION
2 mins • 1 pt

Look at the bar graph, "Nicest Fruit". What does the y-axis show?
Types of fruit
Number of people.
Tags
CCSS.HSN.VM.C.6
3.
MULTIPLE CHOICE QUESTION
2 mins • 1 pt

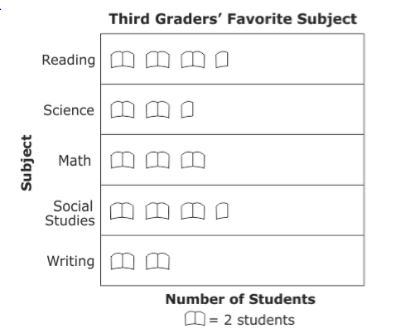
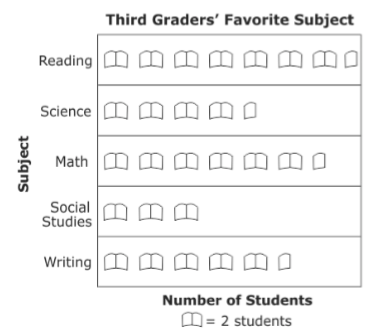
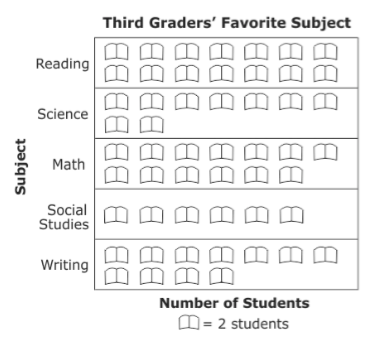
Students in 3rd grade collected data on their favorite subject and recorded it on the table shown. Which graph shows this information?


Tags
CCSS.3.MD.B.3
4.
MULTIPLE CHOICE QUESTION
2 mins • 1 pt

The teacher wants to have 40 more pencils than erasers. How many more pencils does the teacher need to buy?
20
10
30
60
Tags
CCSS.2.MD.D.9
5.
MULTIPLE CHOICE QUESTION
2 mins • 1 pt
What helps organize data?
Table
Graph
Bar
Line
Tags
CCSS.3.MD.B.3
6.
MULTIPLE CHOICE QUESTION
2 mins • 1 pt

Which of these months do NOT have the same numbers of birthdays?
January & April
May & October
September & December
August & November
Tags
CCSS.2.MD.D.9
7.
MULTIPLE CHOICE QUESTION
2 mins • 1 pt

Look at the bar graph, "Nicest Fruit". What scale does the bar graph use?
1
2
5
10
Tags
CCSS.HSN.VM.C.6
Access all questions and much more by creating a free account
Create resources
Host any resource
Get auto-graded reports

Continue with Google

Continue with Email

Continue with Classlink

Continue with Clever
or continue with

Microsoft
%20(1).png)
Apple
Others
Already have an account?
Similar Resources on Wayground

10 questions
Adding Up: Fun with 3 Groups of 2 - Grade 1 Math
Quiz
•
1st Grade - University
![[MATH 4] U9L1_Fractions](https://cf.quizizz.com/image/image-loader.svg)
12 questions
[MATH 4] U9L1_Fractions
Quiz
•
4th Grade

10 questions
Week 31 Spiral Quiz
Quiz
•
4th Grade

15 questions
Customary Conversion Quiz
Quiz
•
4th Grade

13 questions
Q3.Quick Check 2. Math 4 2022-2023
Quiz
•
4th Grade

10 questions
Reflection in 1st Quadrant
Quiz
•
4th - 6th Grade

10 questions
CVAES-G4 Math Quiz- AVERAGE
Quiz
•
4th Grade

10 questions
Rounding numbers
Quiz
•
4th Grade
Popular Resources on Wayground

7 questions
History of Valentine's Day
Interactive video
•
4th Grade

15 questions
Fractions on a Number Line
Quiz
•
3rd Grade

20 questions
Equivalent Fractions
Quiz
•
3rd Grade

25 questions
Multiplication Facts
Quiz
•
5th Grade

22 questions
fractions
Quiz
•
3rd Grade

15 questions
Valentine's Day Trivia
Quiz
•
3rd Grade

20 questions
Main Idea and Details
Quiz
•
5th Grade

20 questions
Context Clues
Quiz
•
6th Grade
Discover more resources for Mathematics

25 questions
Multiplication Facts
Quiz
•
5th Grade

15 questions
Equivalent Fractions
Quiz
•
4th Grade

20 questions
Classifying Triangles
Quiz
•
5th Grade

14 questions
Fractions to Decimals & Decimals to Fractions
Quiz
•
4th Grade

10 questions
Multiplying Fractions
Quiz
•
5th Grade

77 questions
Mixed Multiplication and Division Facts
Quiz
•
4th Grade

10 questions
Data Collection
Quiz
•
4th Grade

16 questions
multiplication facts
Quiz
•
4th Grade


