Motion Graphs Distance/Time =Speed Summative
Authored by Mark Blaisdell
Physics, Science
8th - 10th Grade
Used 8+ times

AI Actions
Add similar questions
Adjust reading levels
Convert to real-world scenario
Translate activity
More...
Content View
Student View
16 questions
Show all answers
1.
MULTIPLE CHOICE QUESTION
5 mins • 1 pt

At 60 seconds, how far had this object traveled?
0 m
10 m
20 m
40 m
2.
MULTIPLE CHOICE QUESTION
5 mins • 1 pt

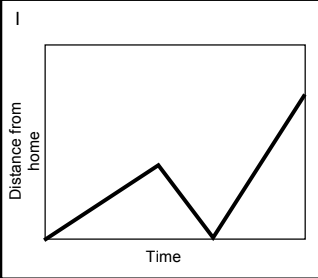
What does this graph represent?
3.
MULTIPLE CHOICE QUESTION
5 mins • 1 pt

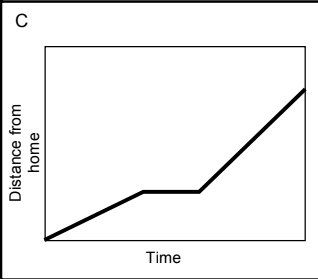
What is happening at C?
Stationary
Accelerating
Constant motion
4.
MULTIPLE CHOICE QUESTION
5 mins • 1 pt

At segment O-A, the bus is _________________.
at rest
accelerating
moving constantly
5.
MULTIPLE CHOICE QUESTION
5 mins • 1 pt

How long did Bob take to complete the race?
17 seconds
12 seconds
14 seconds
15 seconds
6.
MULTIPLE CHOICE QUESTION
5 mins • 1 pt

7.
MULTIPLE CHOICE QUESTION
5 mins • 1 pt
If you travel 10 miles in 5 minutes, what is your speed?


Access all questions and much more by creating a free account
Create resources
Host any resource
Get auto-graded reports
Continue with Google

Continue with Email
Continue with Classlink
Continue with Clever
or continue with
Microsoft
%20(1).png)
Apple
Others
Already have an account?
Similar Resources on Wayground

15 questions
Earth & Space....so far
Quiz
•
9th Grade
14 questions
Scienze 3
Quiz
•
9th Grade
13 questions
MECHANICAL: Physics Equations on energy, work and power
Quiz
•
7th - 10th Grade
15 questions
Science 8 Q1 M4: Effect of Temperature to the Speed of Sound
Quiz
•
8th Grade
13 questions
Atomic Structure
Quiz
•
7th Grade - University
19 questions
Movimientos y fuerzas
Quiz
•
8th Grade
16 questions
P6. Waves
Quiz
•
8th - 12th Grade
11 questions
PTS Ganjil Kelas X Tahun Pelajaran 2024-2025
Quiz
•
10th Grade
Popular Resources on Wayground
15 questions
Fractions on a Number Line
Quiz
•
3rd Grade
20 questions
Equivalent Fractions
Quiz
•
3rd Grade
25 questions
Multiplication Facts
Quiz
•
5th Grade
22 questions
fractions
Quiz
•
3rd Grade
20 questions
Main Idea and Details
Quiz
•
5th Grade
20 questions
Context Clues
Quiz
•
6th Grade
15 questions
Equivalent Fractions
Quiz
•
4th Grade
20 questions
Figurative Language Review
Quiz
•
6th Grade
Discover more resources for Physics
20 questions
Thermal Energy
Quiz
•
5th - 8th Grade
37 questions
Electricity Review
Quiz
•
9th Grade
10 questions
Exit Check 2.4 - 2nd Law Graphs
Quiz
•
9th Grade
10 questions
Exit Check 2.2 - 3rd Law
Quiz
•
9th Grade
10 questions
Exit Check 2.3 - 2nd Law
Quiz
•
9th Grade
10 questions
Exit Check 2.1 - 1st Law
Quiz
•
9th Grade
20 questions
Potential and Kinetic Energy
Quiz
•
9th - 12th Grade
20 questions
8th grade Newton's Law Assessment
Quiz
•
8th Grade