Key Features of Functions
Authored by Erin Fitzgerald
Mathematics
9th - 12th Grade
CCSS covered
Used 5+ times

AI Actions
Add similar questions
Adjust reading levels
Convert to real-world scenario
Translate activity
More...
Content View
Student View
31 questions
Show all answers
1.
MULTIPLE CHOICE QUESTION
10 mins • 5 pts

Which of the statements about the graph is FALSE?
The vertex is a maximum
There are two zeros at x = -3 and x = 3
The y-intercept is (0, 18)
The range is y ≥ 18
Tags
CCSS.HSF-IF.C.7A
2.
MULTIPLE CHOICE QUESTION
10 mins • 5 pts

In the above graph complete the following end behavior:
As x --> -∞, f(x) --> ____
As x --> +∞, f(x) --> ____
-∞
-∞
+∞
+∞
3.
MULTIPLE CHOICE QUESTION
10 mins • 5 pts

In the above graph complete the following end behavior:
As x --> -∞, f(x) --> ____
As x --> +∞, f(x) --> ____
-∞
-∞
+∞
+∞
4.
MULTIPLE CHOICE QUESTION
10 mins • 5 pts

Over which interval is the velocity decreasing?
Tags
CCSS.HSF.IF.B.4
5.
MULTIPLE CHOICE QUESTION
10 mins • 5 pts

When is this function increasing?
6.
MULTIPLE CHOICE QUESTION
10 mins • 5 pts
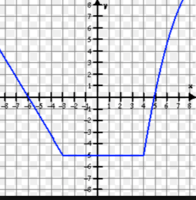
Over what interval is this function constant?
Tags
CCSS.HSF.IF.B.4
7.
MULTIPLE CHOICE QUESTION
10 mins • 5 pts

The blue dot on this graph represents a(n)...
Absolute Maximum
Absolute Minimum
Relative Maximum
Relative Minimum


Access all questions and much more by creating a free account
Create resources
Host any resource
Get auto-graded reports
Continue with Google

Continue with Email
Continue with Classlink
Continue with Clever
or continue with
Microsoft
%20(1).png)
Apple
Others
Already have an account?
Similar Resources on Wayground

26 questions
DE THI TOAN NANG CAO SO 01
Quiz
•
1st Grade - Professio...
26 questions
Key Features of Quadratic Functions Practice
Quiz
•
9th - 12th Grade
27 questions
الدالة التربيعية
Quiz
•
9th Grade
27 questions
Differentiation
Quiz
•
10th - 11th Grade
27 questions
SAT Practice - Module 1
Quiz
•
10th Grade
30 questions
Real Number System Review
Quiz
•
8th - 9th Grade
26 questions
Competencia de Math 9-12
Quiz
•
9th - 12th Grade
26 questions
General Knowledge
Quiz
•
5th - 12th Grade
Popular Resources on Wayground
15 questions
Fractions on a Number Line
Quiz
•
3rd Grade
20 questions
Equivalent Fractions
Quiz
•
3rd Grade
25 questions
Multiplication Facts
Quiz
•
5th Grade
29 questions
Alg. 1 Section 5.1 Coordinate Plane
Quiz
•
9th Grade
22 questions
fractions
Quiz
•
3rd Grade
11 questions
FOREST Effective communication
Lesson
•
KG
20 questions
Main Idea and Details
Quiz
•
5th Grade
20 questions
Context Clues
Quiz
•
6th Grade
Discover more resources for Mathematics
29 questions
Alg. 1 Section 5.1 Coordinate Plane
Quiz
•
9th Grade
20 questions
Graphing Inequalities on a Number Line
Quiz
•
6th - 9th Grade
20 questions
Box and Whisker Plots
Quiz
•
9th Grade
18 questions
Exponential Growth and Decay
Quiz
•
9th Grade
20 questions
Function or Not a Function
Quiz
•
8th - 9th Grade
20 questions
SSS/SAS
Quiz
•
9th - 12th Grade
14 questions
Making Inferences From Samples
Quiz
•
7th - 12th Grade
23 questions
CCG - CH8 Polygon angles and area Review
Quiz
•
9th - 12th Grade