
Compound Probability Tree Diagram
32 Qs

Similar activities
Direct and Inverse Variation
9th Grade
•30 Qs
Unit 1 Pre-Quiz
7th Grade
•27 Qs
Math
11th Grade
•28 Qs
2nd Summative Test in Research 9 (The Central Limit Theorem)
9th Grade
•30 Qs
MC, MR, P = R -C
12th Grade
•30 Qs
MA Revision Year 7
7th Grade
•30 Qs
LATIHAN SOAL PAT
10th Grade
•30 Qs
🐚10th IV 6 unit circle
10th Grade
•27 Qs

Compound Probability Tree Diagram
Quiz
•
Mathematics
•
•
Practice Problem
•
Easy
Standards-aligned

Jordyn Pharris
Used 1+ times
FREE Resource
Enhance your content in a minute
32 questions
Show all answers
1.
MULTIPLE CHOICE QUESTION
15 mins • 1 pt

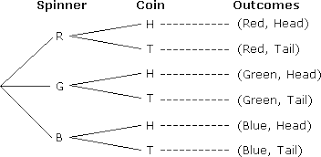
The tree diagram shows the outcomes of rolling a die and flipping a coin.
How many total outcomes are there?
Tags
CCSS.7.SP.C.8B
2.
MULTIPLE CHOICE QUESTION
15 mins • 1 pt
The tree diagram shows the outcomes of rolling a die and flipping a coin.
What is the probability of rolling an even number and flipping a head?
Tags
CCSS.7.SP.C.8B
3.
MULTIPLE CHOICE QUESTION
15 mins • 1 pt

You have a 3 tops, 2 pants and 2 shoes. How many total outfit options are represented?
12 outfits
22 outfits
3 outfits
7 outfits
4.
MULTIPLE CHOICE QUESTION
15 mins • 1 pt
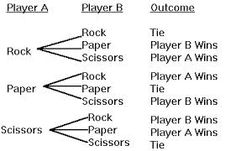
A Tree Diagram is
A written list of all possible outcomes
A description of all possible outcomes
A drawing with branches of all possible outcomes
Tags
CCSS.7.SP.C.8B
5.
MULTIPLE CHOICE QUESTION
15 mins • 1 pt

Use the tree diagram to find the probability of tossing a head first and then a tail when a coin is tossed twice.
1
1/2
1/4
1/8
Tags
CCSS.7.SP.C.8B
6.
MULTIPLE CHOICE QUESTION
15 mins • 1 pt
A tree diagram is useful in determining the __________of a probability experiment.
result
possible outcomes
event
none of the above
Tags
CCSS.7.SP.C.8B
7.
MULTIPLE CHOICE QUESTION
15 mins • 1 pt

What is the probability that you will get plain crust with ham on your pizza?
1/8
1/2
1/10
2/10
Tags
CCSS.7.SP.C.8B


Access all questions and much more by creating a free account
Create resources
Host any resource
Get auto-graded reports
Continue with Google

Continue with Email
Continue with Classlink
Continue with Clever
or continue with
Microsoft
%20(1).png)
Apple
Others
Already have an account?
Similar Resources on Wayground
30 questions
Mathematical Language
Quiz
•
9th - 12th Grade
27 questions
Statistics and Probability Quiz
Quiz
•
12th Grade
31 questions
Exponential Function_Part_2
Quiz
•
11th Grade
28 questions
Identify Factoring Methods
Quiz
•
8th Grade
30 questions
Revision on Sets / Ulangkaji Sets (KSSM Maths F4)
Quiz
•
9th - 12th Grade
30 questions
Maths Revision Quiz 5
Quiz
•
4th Grade
35 questions
Prime factors, LCM, HCF
Quiz
•
4th - 10th Grade
30 questions
Grade 9 Exam Prep 2019
Quiz
•
9th Grade
Popular Resources on Wayground
15 questions
Fractions on a Number Line
Quiz
•
3rd Grade
20 questions
Equivalent Fractions
Quiz
•
3rd Grade
25 questions
Multiplication Facts
Quiz
•
5th Grade
54 questions
Analyzing Line Graphs & Tables
Quiz
•
4th Grade
22 questions
fractions
Quiz
•
3rd Grade
20 questions
Main Idea and Details
Quiz
•
5th Grade
20 questions
Context Clues
Quiz
•
6th Grade
15 questions
Equivalent Fractions
Quiz
•
4th Grade
Discover more resources for Mathematics
20 questions
Place Value
Quiz
•
KG - 3rd Grade
20 questions
Ch. 7 Quadrilateral Quiz Review
Quiz
•
KG - University
12 questions
Quarter Past, Half Past, and Quarter To
Quiz
•
KG - 12th Grade
10 questions
Subtraction to 10
Quiz
•
KG - 1st Grade
14 questions
superbowl 2026 trivia
Quiz
•
KG
30 questions
Comparing Greater Less and Equal
Quiz
•
KG
16 questions
Parallel, Perpendicular, and Intersecting Lines
Quiz
•
KG - Professional Dev...
15 questions
Comparing and Ordering Numbers
Quiz
•
KG - 1st Grade