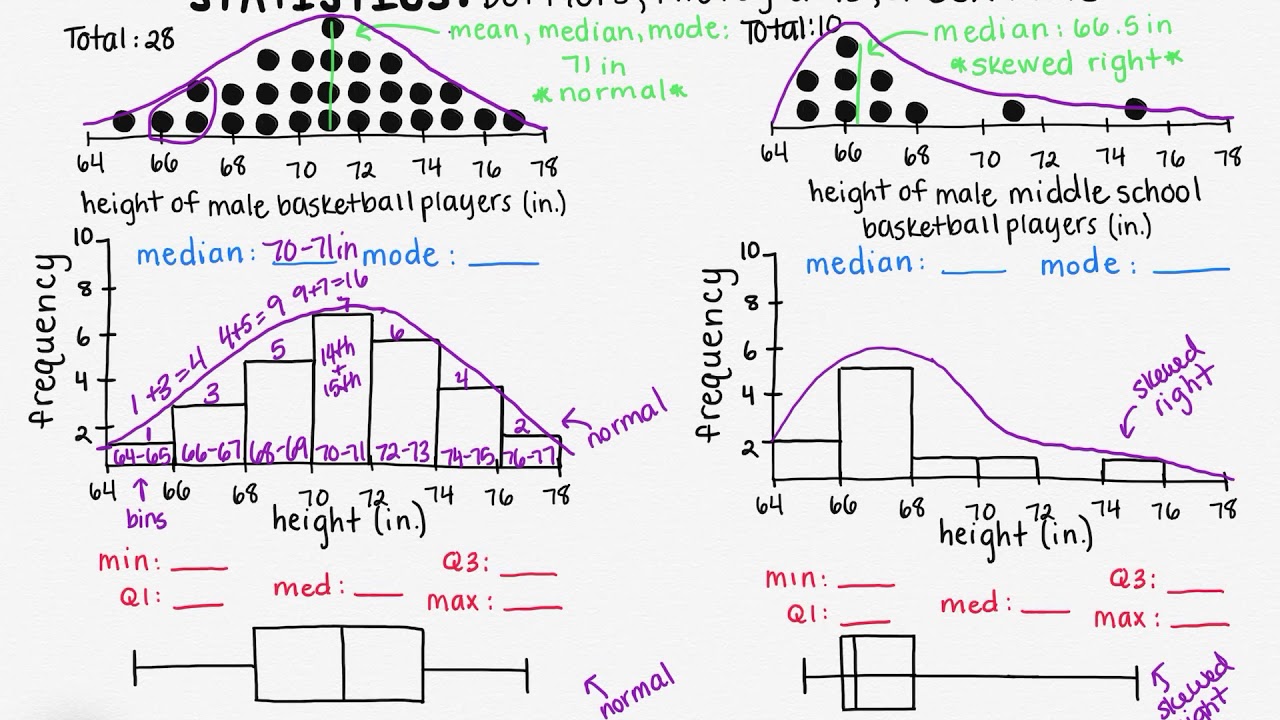
Understanding Dot Plots, Histograms, and Box Plots
Interactive Video
•
Mathematics
•
6th - 10th Grade
•
Easy
Standards-aligned

Wayground Content
Used 1+ times
FREE Resource
10 questions
Show all answers
1.
MULTIPLE CHOICE QUESTION
30 sec • 1 pt
What shape does a normal distribution have in a dot plot?
Bell-shaped curve
Irregular shape
Straight line
Scattered dots
2.
MULTIPLE CHOICE QUESTION
30 sec • 1 pt
What indicates a skewed right distribution in a histogram?
Symmetrical bars
A tail on the right side
Uniform bar heights
A tail on the left side
3.
MULTIPLE CHOICE QUESTION
30 sec • 1 pt
Why can't the mean be accurately found using a histogram?
Because it only shows the median
Because histograms cannot show distributions
Because individual data points are not distinguishable
Because it shows only the mode
Tags
CCSS.6.SP.B.4
CCSS.HSS.ID.A.1
4.
MULTIPLE CHOICE QUESTION
30 sec • 1 pt
What does the median represent in a data set?
The most frequent value
The average of all values
The difference between the highest and lowest values
The middle value when data is ordered
Tags
CCSS.6.SP.B.5C
5.
MULTIPLE CHOICE QUESTION
30 sec • 1 pt
How is the mode identified in a histogram?
The shortest bar
The last bar
The tallest bar
The first bar
Tags
CCSS.6.SP.B.4
CCSS.HSS.ID.A.1
6.
MULTIPLE CHOICE QUESTION
30 sec • 1 pt
What is a drawback of using histograms to find the median?
They show too much detail
They are too complex to understand
They cannot show exact values
They only display the mode
Tags
CCSS.6.SP.B.4
CCSS.HSS.ID.A.1
7.
MULTIPLE CHOICE QUESTION
30 sec • 1 pt
What does Quartile 1 represent in a box plot?
The median of the dataset
The maximum value
The 25th percentile
The minimum value
Tags
CCSS.6.SP.B.4
CCSS.HSS.ID.A.1
Create a free account and access millions of resources
Similar Resources on Wayground

15 questions
Histograms and Box Plots
Quiz
•
6th - 8th Grade

11 questions
Data Displays
Quiz
•
10th Grade

12 questions
Box Plots
Quiz
•
6th Grade

11 questions
Comparing Distributions
Quiz
•
9th Grade

14 questions
Interpret Graphs:6th Grade
Quiz
•
6th Grade

14 questions
Math 1 Unit 1 Practice
Quiz
•
8th - 10th Grade

11 questions
Understanding Data Representation
Quiz
•
6th - 10th Grade

15 questions
Box and Whisker Plots
Quiz
•
7th Grade
Popular Resources on Wayground

10 questions
Lab Safety Procedures and Guidelines
Interactive video
•
6th - 10th Grade

10 questions
Nouns, nouns, nouns
Quiz
•
3rd Grade

10 questions
9/11 Experience and Reflections
Interactive video
•
10th - 12th Grade

25 questions
Multiplication Facts
Quiz
•
5th Grade

11 questions
All about me
Quiz
•
Professional Development

22 questions
Adding Integers
Quiz
•
6th Grade

15 questions
Subtracting Integers
Quiz
•
7th Grade

9 questions
Tips & Tricks
Lesson
•
6th - 8th Grade
Discover more resources for Mathematics

15 questions
Subtracting Integers
Quiz
•
7th Grade

22 questions
Adding Integers
Quiz
•
6th Grade

20 questions
Multiplying and Dividing Integers
Quiz
•
7th Grade

20 questions
Perfect Squares and Square Roots
Quiz
•
7th Grade

20 questions
Adding and Subtracting integers
Quiz
•
7th Grade

20 questions
Adding and Subtracting Integers
Quiz
•
6th Grade

20 questions
Adding and Subtracting Integers
Quiz
•
6th - 7th Grade

21 questions
Convert Fractions, Decimals, and Percents
Quiz
•
6th Grade
