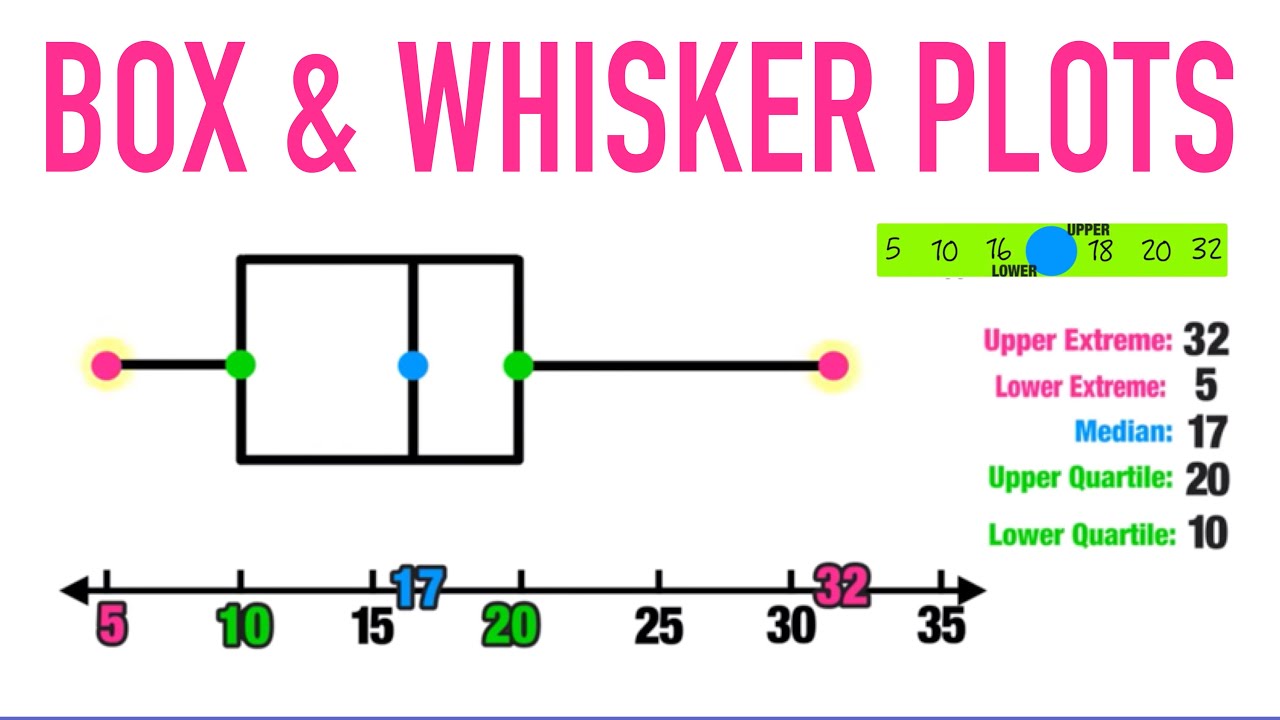
Understanding Box and Whisker Plots
Interactive Video
•
Mathematics
•
6th - 10th Grade
•
Hard

Wayground Content
FREE Resource
10 questions
Show all answers
1.
MULTIPLE CHOICE QUESTION
30 sec • 1 pt
What is the primary purpose of a box and whisker plot?
To calculate the mean of a dataset
To visualize data distribution and range
To predict future data trends
To represent data in a pie chart format
2.
MULTIPLE CHOICE QUESTION
30 sec • 1 pt
What was Jordan's highest score during the last seven games?
32 points
17 points
20 points
5 points
3.
MULTIPLE CHOICE QUESTION
30 sec • 1 pt
What does the median represent in a box and whisker plot?
The lowest value
The highest value
The middle value of the dataset
The average value
4.
MULTIPLE CHOICE QUESTION
30 sec • 1 pt
How does rearranging the data in order from least to greatest help in creating a box and whisker plot?
It is only for aesthetic purposes
It aids in identifying the median and quartiles
It is necessary for calculating the mode
It helps in finding the mean more easily
5.
MULTIPLE CHOICE QUESTION
30 sec • 1 pt
How is the interquartile range represented in a box and whisker plot?
Using a scatter plot
With a pie chart
As a rectangular box
Through horizontal lines
6.
MULTIPLE CHOICE QUESTION
30 sec • 1 pt
What does the upper quartile represent in a box and whisker plot?
The median of the lower half of the dataset
The median of the upper half of the dataset
The lowest value in the dataset
The highest value in the dataset
7.
MULTIPLE CHOICE QUESTION
30 sec • 1 pt
What can be inferred about a dataset if the box in a box and whisker plot is very small?
The dataset has a wide range
The dataset values are very consistent
The dataset is not valid
The dataset contains many outliers
Create a free account and access millions of resources
Similar Resources on Wayground

15 questions
Statistics vocabulary Quiz
Quiz
•
6th Grade

13 questions
Week 35 (Period 6) Box Whisker Plot
Quiz
•
7th Grade

9 questions
Box Plot Skewness
Quiz
•
10th Grade - University

15 questions
Box and Whisker Plots
Quiz
•
7th Grade

15 questions
Mechine Learning
Quiz
•
7th - 9th Grade

11 questions
Understanding Data Analysis: Mean, Median, Mode, and Range
Quiz
•
6th - 10th Grade

11 questions
Finding the Median
Quiz
•
5th - 6th Grade

15 questions
Analyzing and Comparing Data Sets
Quiz
•
7th Grade - University
Popular Resources on Wayground

10 questions
Lab Safety Procedures and Guidelines
Interactive video
•
6th - 10th Grade

10 questions
Nouns, nouns, nouns
Quiz
•
3rd Grade

10 questions
Appointment Passes Review
Quiz
•
6th - 8th Grade

25 questions
Multiplication Facts
Quiz
•
5th Grade

11 questions
All about me
Quiz
•
Professional Development

22 questions
Adding Integers
Quiz
•
6th Grade

15 questions
Subtracting Integers
Quiz
•
7th Grade

20 questions
Grammar Review
Quiz
•
6th - 9th Grade
Discover more resources for Mathematics

15 questions
Subtracting Integers
Quiz
•
7th Grade

22 questions
Adding Integers
Quiz
•
6th Grade

20 questions
Perfect Squares and Square Roots
Quiz
•
7th Grade

15 questions
Integers, Integers, Integers
Quiz
•
7th Grade

20 questions
Adding and Subtracting integers
Quiz
•
7th Grade

20 questions
Adding and Subtracting Integers
Quiz
•
6th - 7th Grade

21 questions
Convert Fractions, Decimals, and Percents
Quiz
•
6th Grade

17 questions
Classifying Real Numbers
Quiz
•
8th Grade
