
Understanding Data and Statistics
6th - 10th Grade
•10 Qs

Similar activities
volume of triangular prism
6th - 7th Grade
•12 Qs
EM Graphs of Power Function
7th Grade
•16 Qs
Decimals Multiplication and Division
7th Grade
•13 Qs
Quiz: Secants, Tangents, and Sectors
9th - 10th Grade
•10 Qs
Coordinate Geometry
10th Grade
•10 Qs
Form 1 Probability - Pre Unit Quiz
6th Grade
•10 Qs
Triangles ,grade 7
7th Grade
•10 Qs
DATA HANDLING 6
6th Grade
•10 Qs
Understanding Data and Statistics
Interactive Video
•
Mathematics
•
6th - 10th Grade
•
Practice Problem
•
Hard
+1
Standards-aligned

Wayground Content
Used 1+ times
FREE Resource
Enhance your content in a minute
10 questions
Show all answers
1.
MULTIPLE CHOICE QUESTION
30 sec • 1 pt
What does the mean represent in data analysis?
The difference between the highest and lowest values
The average value of the dataset
The most frequently occurring value
The middle value of the dataset
Tags
CCSS.6.SP.B.5C
2.
MULTIPLE CHOICE QUESTION
30 sec • 1 pt
How is the median determined in a dataset?
By ordering the data and finding the middle value
By dividing the sum of all values by the number of values
By subtracting the lowest value from the highest value
By finding the value that appears most frequently
Tags
CCSS.6.SP.B.5C
3.
MULTIPLE CHOICE QUESTION
30 sec • 1 pt
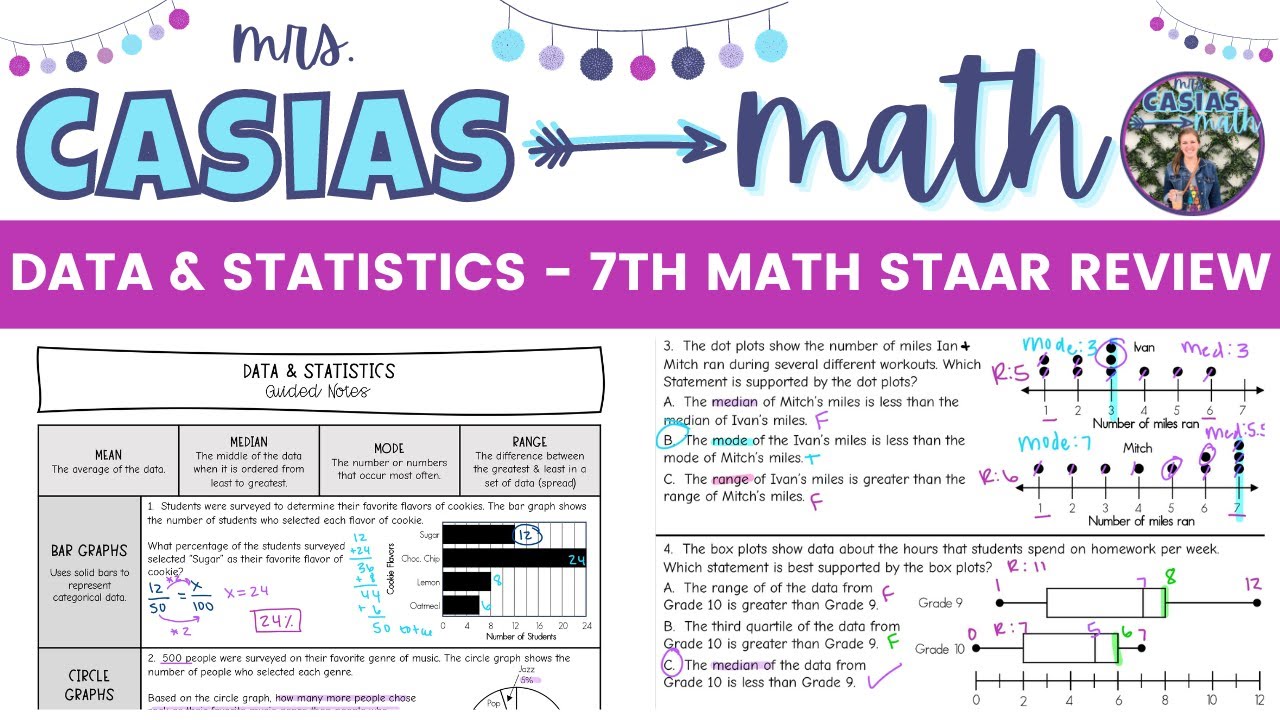
What percentage of students chose sugar as their favorite cookie flavor?
24%
36%
50%
12%
4.
MULTIPLE CHOICE QUESTION
30 sec • 1 pt
What does the range in a dataset tell us?
The average value
The most frequent value
The middle value
The spread of the data
Tags
CCSS.6.SP.A.3
5.
MULTIPLE CHOICE QUESTION
30 sec • 1 pt
In the circle graph example, how many more people preferred rock over jazz?
25 people
500 people
30 people
125 people
6.
MULTIPLE CHOICE QUESTION
30 sec • 1 pt
What does a dot plot represent?
Data spread and outliers
Frequency of data points
Percentage of a whole
Categorical data
Tags
CCSS.6.SP.B.4
CCSS.HSS.ID.A.1
7.
MULTIPLE CHOICE QUESTION
30 sec • 1 pt
Which statement was true according to the dot plot example?
Mitch's median miles were less than Ivan's
The mode of Ivan's miles was less than Mitch's
Ivan's mode of miles was greater than Mitch's
Ivan's range of miles was greater than Mitch's
Tags
CCSS.6.SP.B.4
CCSS.HSS.ID.A.1
Access all questions and much more by creating a free account
Create resources
Host any resource
Get auto-graded reports
Continue with Google

Continue with Email
Continue with Classlink
Continue with Clever
or continue with
Microsoft
%20(1).png)
Apple
Others
Already have an account?
Similar Resources on Wayground
12 questions
Mathematic Revision
Quiz
•
6th - 9th Grade
12 questions
M1 Mid Module Test Review
Quiz
•
6th Grade
15 questions
7th Grade Math - Test Review (Algebra)
Quiz
•
7th Grade
15 questions
KUASA TIGA DAN PUNCA KUASA TIGA
Quiz
•
7th - 9th Grade
10 questions
MGSE.7.G2 (Triangles)
Quiz
•
KG - University
10 questions
Proportion Word Problems
Quiz
•
6th Grade
12 questions
Revision
Quiz
•
6th Grade
10 questions
Polynomials with Fractions Quiz
Quiz
•
7th Grade
Popular Resources on Wayground
15 questions
Fractions on a Number Line
Quiz
•
3rd Grade
20 questions
Equivalent Fractions
Quiz
•
3rd Grade
25 questions
Multiplication Facts
Quiz
•
5th Grade
54 questions
Analyzing Line Graphs & Tables
Quiz
•
4th Grade
22 questions
fractions
Quiz
•
3rd Grade
20 questions
Main Idea and Details
Quiz
•
5th Grade
20 questions
Context Clues
Quiz
•
6th Grade
15 questions
Equivalent Fractions
Quiz
•
4th Grade
Discover more resources for Mathematics
22 questions
distributive property
Quiz
•
7th Grade
18 questions
Angle Relationships
Quiz
•
7th Grade
15 questions
Distributive Property & Review
Quiz
•
6th Grade
20 questions
Writing Algebraic Expressions
Quiz
•
6th Grade
20 questions
How Some Friendships Last — and Others Don’t Video Questions
Quiz
•
7th Grade
14 questions
finding slope from a graph
Quiz
•
8th Grade
20 questions
Ratios/Rates and Unit Rates
Quiz
•
6th Grade
18 questions
Handbook Refresher Quiz
Quiz
•
7th Grade