56_SP_KeerthanaT
Quiz
•
English, Mathematics
•
6th Grade
•
Practice Problem
•
Hard
Keerthana Thirunavukkarasu
FREE Resource
Enhance your content in a minute
30 questions
Show all answers
1.
MULTIPLE CHOICE QUESTION
2 mins • 1 pt
For which of the following would it be inappropriate to display the data with a single pie chart?
The distribution of car colors for vehicles purchased in the last month.
The distribution of unemployment percentages for each of the 50 states.
The distribution of favorite sport for a sample of 30 middle school students.
The distribution of shoe type worn by shoppers at a local mall.
The distribution of presidential candidate preference for voters in a state.
2.
MULTIPLE CHOICE QUESTION
1 min • 1 pt

the pie chart shows the different types of vehicles involved in road accidents in a city last years.
which type of vehicles had the highest number of road accidents last year?
Motorcycle
Cars
Good Vehicles
Buses
3.
MULTIPLE CHOICE QUESTION
2 mins • 1 pt

the pie chart shows what Hanry does with his weekly allowance.
what percentage of his allowance does his spend on stationary?
10%
50%
90%
25%
4.
MULTIPLE CHOICE QUESTION
30 sec • 1 pt

A PIE Chart is created using
5.
MULTIPLE CHOICE QUESTION
30 sec • 1 pt
Data for a PIE Chart comes from a
6.
MULTIPLE CHOICE QUESTION
30 sec • 1 pt

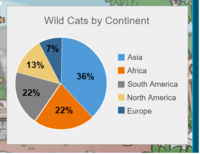
Which Continent is home to 36% of the wild cats?
7.
MULTIPLE CHOICE QUESTION
1 min • 1 pt

What type of graph is this?
Access all questions and much more by creating a free account
Create resources
Host any resource
Get auto-graded reports

Continue with Google

Continue with Email

Continue with Classlink

Continue with Clever
or continue with

Microsoft
%20(1).png)
Apple
Others
Already have an account?
Similar Resources on Wayground

25 questions
SPELLING
Quiz
•
2nd - 6th Grade

25 questions
Countables and uncountables
Quiz
•
6th Grade

25 questions
Starland 3- unit 2- vocabulary
Quiz
•
6th - 8th Grade

25 questions
The Dog of Pompeii
Quiz
•
6th Grade

25 questions
Asesmen Sumatif 1
Quiz
•
5th Grade - University

25 questions
Refugee pgs. 147-196
Quiz
•
6th - 8th Grade

27 questions
ANIMAL SOUNDS AND HOMES
Quiz
•
2nd - 7th Grade

25 questions
Goverment
Quiz
•
6th Grade
Popular Resources on Wayground

15 questions
Fractions on a Number Line
Quiz
•
3rd Grade

20 questions
Equivalent Fractions
Quiz
•
3rd Grade

25 questions
Multiplication Facts
Quiz
•
5th Grade

54 questions
Analyzing Line Graphs & Tables
Quiz
•
4th Grade

22 questions
fractions
Quiz
•
3rd Grade

20 questions
Main Idea and Details
Quiz
•
5th Grade

20 questions
Context Clues
Quiz
•
6th Grade

15 questions
Equivalent Fractions
Quiz
•
4th Grade
Discover more resources for English

20 questions
Context Clues
Quiz
•
6th Grade

20 questions
Figurative Language Review
Quiz
•
6th Grade

15 questions
Main Idea and Supporting Details.
Quiz
•
4th - 11th Grade

15 questions
6th Context Clues
Quiz
•
6th Grade

12 questions
Final Figurative Language Review
Lesson
•
6th - 8th Grade

16 questions
Argumentative Writing
Quiz
•
6th Grade

16 questions
6.L.5 - Connotation vs. Denotation
Quiz
•
6th Grade

10 questions
Main Idea and Supporting Details
Quiz
•
3rd - 6th Grade


