Exploring the Correlation Coefficient in Statistics
Interactive Video
•
Mathematics
•
8th - 12th Grade
•
Practice Problem
•
Hard
Standards-aligned

Olivia Brooks
FREE Resource
Standards-aligned
Read more
10 questions
Show all answers
1.
MULTIPLE CHOICE QUESTION
30 sec • 1 pt
What is the purpose of the correlation coefficient in statistics?
To measure the average of data points
To calculate the median of a dataset
To find the mode of a dataset
To determine the randomness or trend in a scatter plot
Tags
CCSS.HSS.ID.B.5
2.
MULTIPLE CHOICE QUESTION
30 sec • 1 pt
What is the range of values that the correlation coefficient can take?
Between -2 and 2
Between -1 and 1
Between -0.5 and 0.5
Between 0 and 1
Tags
CCSS.HSS.ID.B.5
3.
MULTIPLE CHOICE QUESTION
30 sec • 1 pt
What does a correlation coefficient of 1 indicate?
The scatter plot has a perfect downhill trend
The scatter plot has a perfect uphill trend
The scatter plot has no trend
The scatter plot is perfectly random
Tags
CCSS.HSS.ID.B.5
4.
MULTIPLE CHOICE QUESTION
30 sec • 1 pt
What does a correlation coefficient of -1 indicate?
The scatter plot is perfectly random
The scatter plot has a perfect uphill trend
The scatter plot has no trend
The scatter plot has a perfect downhill trend
Tags
CCSS.HSS.ID.C.8
5.
MULTIPLE CHOICE QUESTION
30 sec • 1 pt
What does a correlation coefficient close to 0 indicate?
The scatter plot has a perfect downhill trend
The scatter plot has a perfect uphill trend
The scatter plot has no trend
The scatter plot is perfectly random
Tags
CCSS.HSS.ID.B.5
6.
MULTIPLE CHOICE QUESTION
30 sec • 1 pt
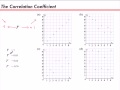
Which graph would have a correlation coefficient of exactly 1?
Graph D
Graph A
Graph B
Graph C
Tags
CCSS.HSS.ID.C.8
7.
MULTIPLE CHOICE QUESTION
30 sec • 1 pt
Which graph would have a correlation coefficient of 0.05?
Graph A
Graph D
Graph B
Graph C
Tags
CCSS.HSS.ID.C.8
Access all questions and much more by creating a free account
Create resources
Host any resource
Get auto-graded reports
Continue with Google

Continue with Email
Continue with Classlink
Continue with Clever
or continue with
Microsoft
%20(1).png)
Apple
Others
Already have an account?
Similar Resources on Wayground

11 questions
Understanding Semi-Log Plots and Exponential Functions
Interactive video
•
9th - 12th Grade
11 questions
Graphing Calculator Functions and Features
Interactive video
•
9th - 12th Grade
11 questions
Understanding the Coefficient of Variation
Interactive video
•
9th - 12th Grade
11 questions
Complex Numbers and Their Operations
Interactive video
•
9th - 12th Grade
11 questions
Understanding Function Transformations
Interactive video
•
9th - 12th Grade
11 questions
Matrix Multiplication and Transformations Quiz
Interactive video
•
9th - 12th Grade
11 questions
Understanding Half Angle Identities and Trigonometric Calculations
Interactive video
•
9th - 12th Grade
Popular Resources on Wayground
15 questions
Fractions on a Number Line
Quiz
•
3rd Grade
20 questions
Equivalent Fractions
Quiz
•
3rd Grade
25 questions
Multiplication Facts
Quiz
•
5th Grade
22 questions
fractions
Quiz
•
3rd Grade
20 questions
Main Idea and Details
Quiz
•
5th Grade
20 questions
Context Clues
Quiz
•
6th Grade
15 questions
Equivalent Fractions
Quiz
•
4th Grade
20 questions
Figurative Language Review
Quiz
•
6th Grade
Discover more resources for Mathematics
15 questions
Product of Powers Property A1 U7
Quiz
•
8th Grade
20 questions
Laws of Exponents
Quiz
•
8th Grade
16 questions
8th U5L5 Graphs of Functions
Quiz
•
8th Grade
20 questions
Graphing Inequalities on a Number Line
Quiz
•
6th - 9th Grade
12 questions
Exponential Growth and Decay
Quiz
•
9th Grade
20 questions
Exponent Rules Review
Quiz
•
8th - 9th Grade
20 questions
One Step equations addition and subtraction
Quiz
•
5th - 8th Grade
20 questions
Translations
Quiz
•
8th Grade