Mastering Trend Line Predictions
Interactive Video
•
Mathematics
•
8th - 12th Grade
•
Practice Problem
•
Medium
+1
Standards-aligned

Sophia Harris
Used 1+ times
FREE Resource
Standards-aligned
Read more
10 questions
Show all answers
1.
MULTIPLE CHOICE QUESTION
30 sec • 1 pt
What is the purpose of a trendline in a scatter plot?
To lie as close as possible to the data points and show the overall trend
To highlight the highest and lowest points
To create a curved line through the data points
To connect all the data points exactly
Tags
CCSS.8.SP.A.2
2.
MULTIPLE CHOICE QUESTION
30 sec • 1 pt
When sketching a trendline, what is the main goal?
To avoid touching any data points
To match the overall shape of the data
To ensure the line is horizontal
To make the line as long as possible
Tags
CCSS.8.SP.A.2
3.
MULTIPLE CHOICE QUESTION
30 sec • 1 pt
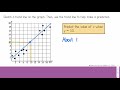
If x is 7, what is the predicted value of y based on the trendline?
40
60
30
50
4.
MULTIPLE CHOICE QUESTION
30 sec • 1 pt
What is the first step in predicting y when x is given?
Plot a point at the origin
Start at the y-axis
Draw a vertical line from the x-axis value
Draw a horizontal line from the y-axis value
Tags
CCSS.HSF.IF.A.2
5.
MULTIPLE CHOICE QUESTION
30 sec • 1 pt
If y is 10, what is the predicted value of x based on the trendline?
20
15
10
5
Tags
CCSS.HSF.LE.B.5
6.
MULTIPLE CHOICE QUESTION
30 sec • 1 pt
What is the first step in predicting x when y is given?
Plot a point at the origin
Draw a horizontal line from the x-axis value
Draw a vertical line from the y-axis value
Start at the x-axis
Tags
CCSS.HSF.IF.A.2
7.
MULTIPLE CHOICE QUESTION
30 sec • 1 pt
In the polar bear example, what is the predicted age of a polar bear that weighs 50 pounds?
5 months
9 months
3 months
7 months
Access all questions and much more by creating a free account
Create resources
Host any resource
Get auto-graded reports
Continue with Google

Continue with Email
Continue with Classlink
Continue with Clever
or continue with
Microsoft
%20(1).png)
Apple
Others
Already have an account?
Popular Resources on Wayground

15 questions
Fractions on a Number Line
Quiz
•
3rd Grade
10 questions
Probability Practice
Quiz
•
4th Grade
15 questions
Probability on Number LIne
Quiz
•
4th Grade
20 questions
Equivalent Fractions
Quiz
•
3rd Grade
25 questions
Multiplication Facts
Quiz
•
5th Grade
22 questions
fractions
Quiz
•
3rd Grade
6 questions
Appropriate Chromebook Usage
Lesson
•
7th Grade
10 questions
Greek Bases tele and phon
Quiz
•
6th - 8th Grade
Discover more resources for Mathematics
23 questions
TSI Math Vocabulary
Quiz
•
10th - 12th Grade
15 questions
Graphing Inequalities
Quiz
•
7th - 9th Grade
20 questions
Graphing Inequalities on a Number Line
Quiz
•
6th - 9th Grade
8 questions
8th U5L20 Volume of Sphere
Quiz
•
8th Grade
20 questions
Solving Systems of Equations Review
Quiz
•
8th Grade
20 questions
Slope from a Graph
Quiz
•
8th Grade
15 questions
Combine Like Terms and Distributive Property
Quiz
•
8th - 9th Grade
10 questions
Plotting Points on a Coordinate Plane: Quadrant 1 Essentials
Interactive video
•
6th - 10th Grade