Exploring Functions, Tables, and Graphs
Interactive Video
•
Mathematics
•
8th - 12th Grade
•
Practice Problem
•
Hard
Standards-aligned

Jackson Turner
FREE Resource
Standards-aligned
Read more
10 questions
Show all answers
1.
MULTIPLE CHOICE QUESTION
30 sec • 1 pt
What is a function in mathematical terms?
A relation where each x-value is used only once
A relation where each y-value is used only once
A relation where y-values can be repeated
A relation where x-values can be repeated
Tags
CCSS.8.F.A.1
2.
MULTIPLE CHOICE QUESTION
30 sec • 1 pt
What is another term for the x-value in a function?
Slope
Input
Range
Output
Tags
CCSS.8.F.A.1
CCSS.HSF.IF.A.1
3.
MULTIPLE CHOICE QUESTION
30 sec • 1 pt
What does the term 'domain' refer to in mathematics?
The set of all y-values
The set of all x-values
The set of all ordered pairs
The set of all linear equations
Tags
CCSS.8.F.A.1
CCSS.HSF.IF.A.1
4.
MULTIPLE CHOICE QUESTION
30 sec • 1 pt
What is the y-value also known as?
Slope
Domain
Range
Input
Tags
CCSS.8.F.A.1
CCSS.HSF.IF.A.1
5.
MULTIPLE CHOICE QUESTION
30 sec • 1 pt
What do the first four letters of 'linear' spell, and why is it important?
Liar, because it can be misleading
Lean, because the graph leans to one side
Line, because a linear equation graphs as a line
Near, because the points are close
6.
MULTIPLE CHOICE QUESTION
30 sec • 1 pt
Which of the following is NOT a characteristic of a linear equation?
It can be a horizontal or vertical line
Each x-value is used only once
It graphs as a straight line
It can form a curve or a circle
7.
MULTIPLE CHOICE QUESTION
30 sec • 1 pt
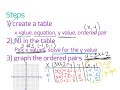
What is the first step in graphing a linear equation?
Choosing y-values
Finding the slope
Creating a table
Drawing the graph
Access all questions and much more by creating a free account
Create resources
Host any resource
Get auto-graded reports
Continue with Google

Continue with Email
Continue with Classlink
Continue with Clever
or continue with
Microsoft
%20(1).png)
Apple
Others
Already have an account?
Popular Resources on Wayground

15 questions
Fractions on a Number Line
Quiz
•
3rd Grade
20 questions
Equivalent Fractions
Quiz
•
3rd Grade
25 questions
Multiplication Facts
Quiz
•
5th Grade
54 questions
Analyzing Line Graphs & Tables
Quiz
•
4th Grade
22 questions
fractions
Quiz
•
3rd Grade
20 questions
Main Idea and Details
Quiz
•
5th Grade
20 questions
Context Clues
Quiz
•
6th Grade
15 questions
Equivalent Fractions
Quiz
•
4th Grade
Discover more resources for Mathematics
14 questions
finding slope from a graph
Quiz
•
8th Grade
20 questions
Laws of Exponents
Quiz
•
8th Grade
12 questions
8th U5L9 Linear Models
Quiz
•
8th Grade
20 questions
Graphing Inequalities on a Number Line
Quiz
•
6th - 9th Grade
18 questions
SAT Prep: Ratios, Proportions, & Percents
Quiz
•
9th - 10th Grade
20 questions
Volume of cylinders, Cones and Spheres
Quiz
•
8th Grade
12 questions
Exponential Growth and Decay
Quiz
•
9th Grade
20 questions
One Step equations addition and subtraction
Quiz
•
5th - 8th Grade