Exploring the Normal Curve in Algebra
Interactive Video
•
Mathematics
•
6th - 10th Grade
•
Practice Problem
•
Hard
Standards-aligned

Mia Campbell
FREE Resource
Standards-aligned
Read more
10 questions
Show all answers
1.
MULTIPLE CHOICE QUESTION
30 sec • 1 pt
What is another name for the normal distribution curve?
Linear curve
Exponential curve
Bell curve
Skewed curve
2.
MULTIPLE CHOICE QUESTION
30 sec • 1 pt
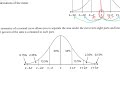
What percentage of data falls within one standard deviation of the mean in a normal distribution?
68%
34%
95%
99.7%
Tags
CCSS.HSS.ID.A.4
3.
MULTIPLE CHOICE QUESTION
30 sec • 1 pt
How much data is covered if you step one standard deviation to the right or left of the mean?
34%
68%
99.7%
95%
Tags
CCSS.HSS.ID.A.4
4.
MULTIPLE CHOICE QUESTION
30 sec • 1 pt
If you step two standard deviations away from the mean, what percentage of the data is covered?
68%
95%
34%
99.7%
Tags
CCSS.HSS.ID.A.4
5.
MULTIPLE CHOICE QUESTION
30 sec • 1 pt
What is the percentage of data that falls within three standard deviations of the mean?
34%
99.7%
95%
68%
Tags
CCSS.HSS.ID.A.4
6.
MULTIPLE CHOICE QUESTION
30 sec • 1 pt
What is the total percentage of data that falls within two standard deviations of the mean?
34%
99.7%
95%
68%
Tags
CCSS.HSS.ID.A.4
7.
MULTIPLE CHOICE QUESTION
30 sec • 1 pt
What is the mean value in the example problem involving pennies?
2.6 grams
2.7 grams
2.4 grams
2.5 grams
Tags
CCSS.HSF-LE.A.1B
Access all questions and much more by creating a free account
Create resources
Host any resource
Get auto-graded reports
Continue with Google

Continue with Email
Continue with Classlink
Continue with Clever
or continue with
Microsoft
%20(1).png)
Apple
Others
Already have an account?
Similar Resources on Wayground

11 questions
Understanding Arc Length of a Circle
Interactive video
•
7th - 10th Grade
11 questions
Understanding the Science of Curiosity and Information
Interactive video
•
7th - 12th Grade
11 questions
Understanding Systems of Linear Equations
Interactive video
•
7th - 10th Grade
11 questions
Understanding Quadratic Equations
Interactive video
•
7th - 10th Grade
11 questions
Solving Linear Equations and Inequalities
Interactive video
•
7th - 10th Grade
Popular Resources on Wayground
15 questions
Fractions on a Number Line
Quiz
•
3rd Grade
20 questions
Equivalent Fractions
Quiz
•
3rd Grade
25 questions
Multiplication Facts
Quiz
•
5th Grade
54 questions
Analyzing Line Graphs & Tables
Quiz
•
4th Grade
22 questions
fractions
Quiz
•
3rd Grade
20 questions
Main Idea and Details
Quiz
•
5th Grade
20 questions
Context Clues
Quiz
•
6th Grade
15 questions
Equivalent Fractions
Quiz
•
4th Grade
Discover more resources for Mathematics
22 questions
distributive property
Quiz
•
7th Grade
18 questions
Angle Relationships
Quiz
•
7th Grade
15 questions
Distributive Property & Review
Quiz
•
6th Grade
20 questions
Writing Algebraic Expressions
Quiz
•
6th Grade
20 questions
How Some Friendships Last — and Others Don’t Video Questions
Quiz
•
7th Grade
14 questions
finding slope from a graph
Quiz
•
8th Grade
20 questions
Ratios/Rates and Unit Rates
Quiz
•
6th Grade
18 questions
Handbook Refresher Quiz
Quiz
•
7th Grade