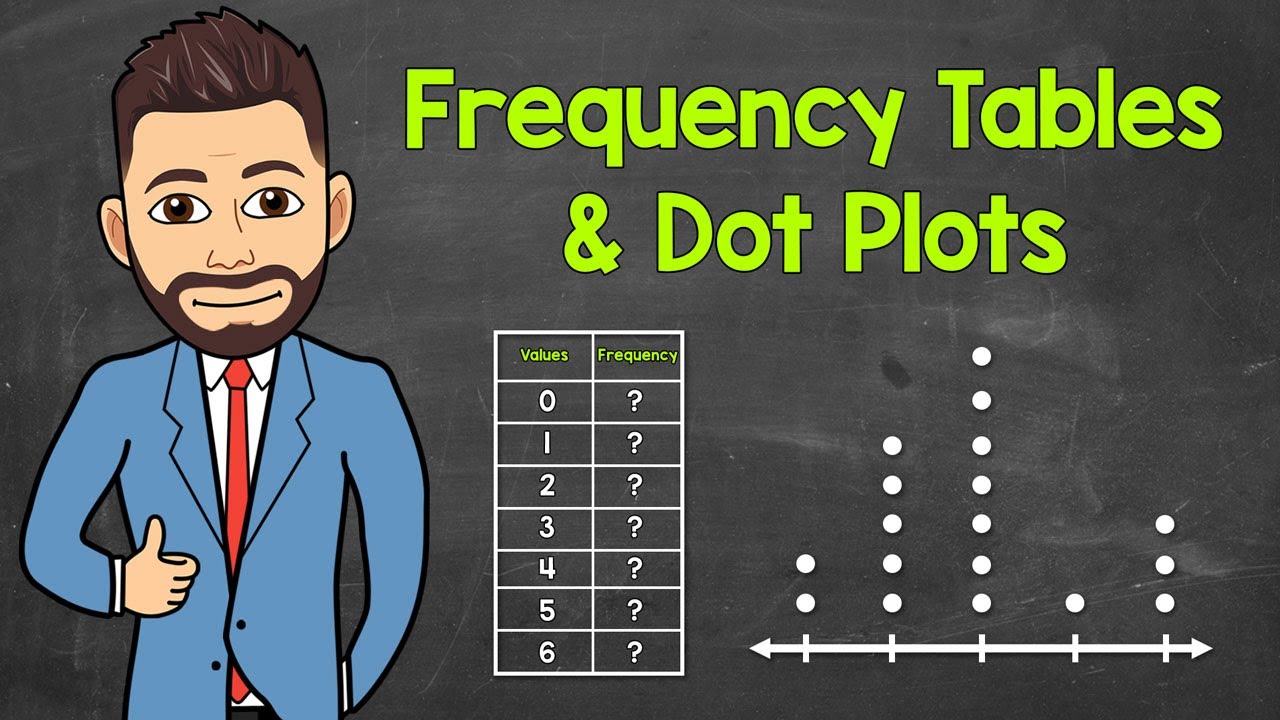
Creating Frequency Tables and Dot Plots
Interactive Video
•
Mathematics
•
6th - 10th Grade
•
Practice Problem
•
Hard
+3
Standards-aligned

Mia Campbell
FREE Resource
Standards-aligned
10 questions
Show all answers
1.
MULTIPLE CHOICE QUESTION
30 sec • 1 pt
What is the main purpose of using frequency tables and dot plots?
To complicate data representation
To focus on individual data points only
To organize and represent data clearly
To increase the amount of data needed
Tags
CCSS.6.SP.B.4
CCSS.HSS.ID.A.1
2.
MULTIPLE CHOICE QUESTION
30 sec • 1 pt
What is the first step in creating a frequency table?
Identifying the lowest and highest values
Tallying the data
Identifying the highest value
Drawing the table
3.
MULTIPLE CHOICE QUESTION
30 sec • 1 pt
How many rows are needed for a frequency table with values ranging from 0 to 6?
5
8
7
6
4.
MULTIPLE CHOICE QUESTION
30 sec • 1 pt
What does the tally column in a frequency table help with?
Reducing the accuracy of the data
Making the table look complex
Working through the data and finding frequencies
Increasing the table size
Tags
CCSS.1.MD.C.4
5.
MULTIPLE CHOICE QUESTION
30 sec • 1 pt
What is the final step in completing a frequency table?
Adding a title
Drawing the table
Identifying the highest value
Tallying the data
Tags
CCSS.8.SP.A.4
6.
MULTIPLE CHOICE QUESTION
30 sec • 1 pt
What is the first step in creating a dot plot?
Adding a title
Drawing dots for each data point
Drawing a number line
Labeling the number line
Tags
CCSS.6.SP.B.4
CCSS.HSS.ID.A.1
7.
MULTIPLE CHOICE QUESTION
30 sec • 1 pt
How is the number line in a dot plot labeled for this data set?
By the number of people
By the number of subscriptions
By the total frequency
By the number of streaming services
Tags
CCSS.6.SP.B.4
CCSS.HSS.ID.A.1
Access all questions and much more by creating a free account
Create resources
Host any resource
Get auto-graded reports
Continue with Google

Continue with Email
Continue with Classlink
Continue with Clever
or continue with
Microsoft
%20(1).png)
Apple
Others
Already have an account?
Popular Resources on Wayground

7 questions
History of Valentine's Day
Interactive video
•
4th Grade
15 questions
Fractions on a Number Line
Quiz
•
3rd Grade
20 questions
Equivalent Fractions
Quiz
•
3rd Grade
25 questions
Multiplication Facts
Quiz
•
5th Grade
22 questions
fractions
Quiz
•
3rd Grade
15 questions
Valentine's Day Trivia
Quiz
•
3rd Grade
20 questions
Main Idea and Details
Quiz
•
5th Grade
20 questions
Context Clues
Quiz
•
6th Grade
Discover more resources for Mathematics
20 questions
Writing Algebraic Expressions
Quiz
•
6th Grade
20 questions
Ratios/Rates and Unit Rates
Quiz
•
6th Grade
14 questions
Volume of rectangular prisms
Quiz
•
7th Grade
20 questions
Laws of Exponents
Quiz
•
8th Grade
20 questions
Graphing Inequalities on a Number Line
Quiz
•
6th - 9th Grade
20 questions
One Step Equations
Quiz
•
6th Grade
20 questions
Exponent Properties
Quiz
•
9th Grade
10 questions
Solving One Step Inequalities
Quiz
•
6th Grade