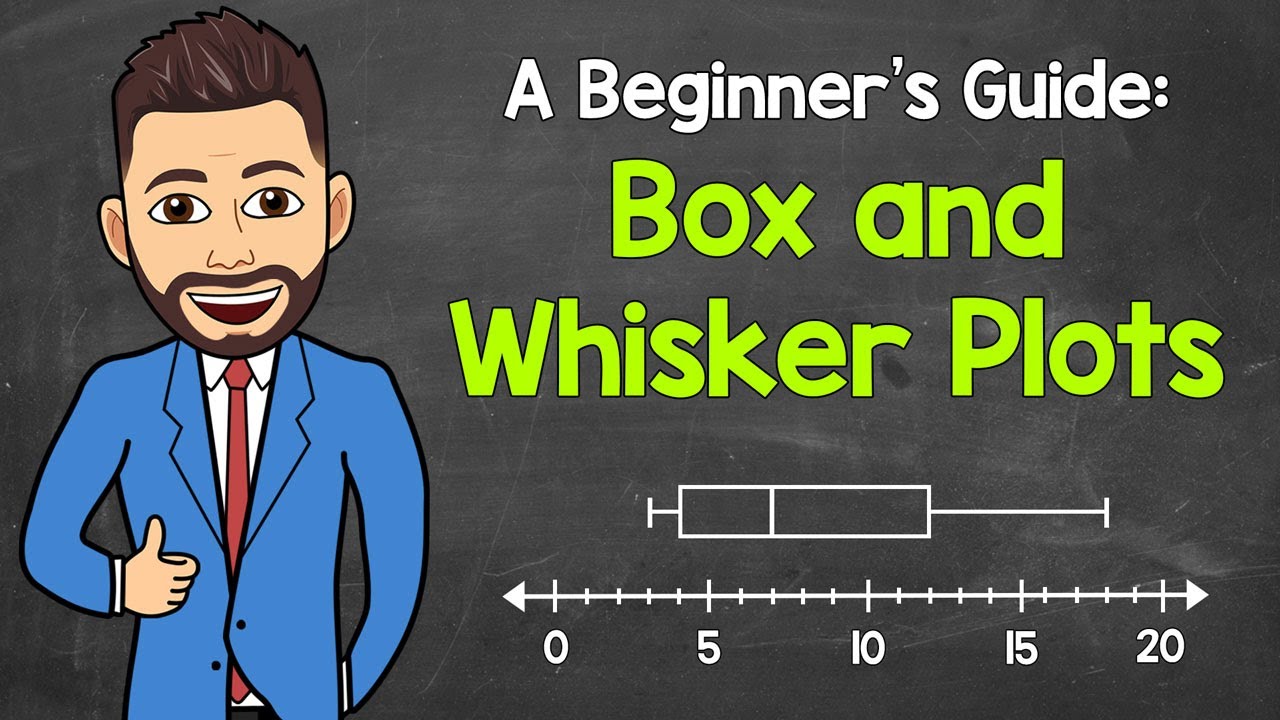
Interpreting Box and Whisker Plots
Interactive Video
•
Mathematics
•
6th - 10th Grade
•
Practice Problem
•
Medium
Standards-aligned

Aiden Montgomery
Used 8+ times
FREE Resource
Standards-aligned
Read more
10 questions
Show all answers
1.
MULTIPLE CHOICE QUESTION
30 sec • 1 pt
What does the line inside the rectangle of a box and whisker plot represent?
The median of the data
The maximum value
The minimum value
The first quartile
Tags
CCSS.6.SP.B.4
CCSS.HSS.ID.A.1
2.
MULTIPLE CHOICE QUESTION
30 sec • 1 pt
How do you find the median when there are two middle numbers?
Choose the smaller number
Ignore both numbers
Choose the larger number
Calculate the average of the two numbers
Tags
CCSS.6.SP.B.5C
3.
MULTIPLE CHOICE QUESTION
30 sec • 1 pt
How is the first quartile represented in a box and whisker plot?
As a line inside the rectangle
As the leftmost edge of the rectangle
As a line outside the rectangle
As the rightmost edge of the rectangle
Tags
CCSS.6.SP.B.4
CCSS.HSS.ID.A.1
4.
MULTIPLE CHOICE QUESTION
30 sec • 1 pt
What percentage of data is represented between the first quartile and the median in a box and whisker plot?
100%
50%
25%
75%
Tags
CCSS.6.SP.B.4
CCSS.HSS.ID.A.1
5.
MULTIPLE CHOICE QUESTION
30 sec • 1 pt
What does the third quartile represent in a box and whisker plot?
The median of the lower half of the data
The median of the upper half of the data
The maximum value of the data
The minimum value of the data
Tags
CCSS.6.SP.B.4
CCSS.HSS.ID.A.1
6.
MULTIPLE CHOICE QUESTION
30 sec • 1 pt
In the context of box and whisker plots, what does the term 'interquartile range' refer to?
The range between the minimum and the first quartile
The range between the third quartile and the maximum
The range between the first quartile and the third quartile
The total range of the data
Tags
CCSS.6.SP.B.5C
7.
MULTIPLE CHOICE QUESTION
30 sec • 1 pt
What do the 'whiskers' in a box and whisker plot extend to?
The first and third quartiles
The minimum and the maximum values
The median and the third quartile
The median and the maximum values
Tags
CCSS.6.SP.B.4
CCSS.HSS.ID.A.1
Access all questions and much more by creating a free account
Create resources
Host any resource
Get auto-graded reports
Continue with Google

Continue with Email
Continue with Classlink
Continue with Clever
or continue with
Microsoft
%20(1).png)
Apple
Others
Already have an account?
Popular Resources on Wayground

15 questions
Fractions on a Number Line
Quiz
•
3rd Grade
20 questions
Equivalent Fractions
Quiz
•
3rd Grade
25 questions
Multiplication Facts
Quiz
•
5th Grade
29 questions
Alg. 1 Section 5.1 Coordinate Plane
Quiz
•
9th Grade
22 questions
fractions
Quiz
•
3rd Grade
11 questions
FOREST Effective communication
Lesson
•
KG
20 questions
Main Idea and Details
Quiz
•
5th Grade
20 questions
Context Clues
Quiz
•
6th Grade
Discover more resources for Mathematics
29 questions
Alg. 1 Section 5.1 Coordinate Plane
Quiz
•
9th Grade
36 questions
6th Grade Math STAAR Review
Quiz
•
6th Grade
14 questions
Volume of rectangular prisms
Quiz
•
7th Grade
14 questions
finding slope from a graph
Quiz
•
8th Grade
20 questions
Graphing Inequalities on a Number Line
Quiz
•
6th - 9th Grade
23 questions
Solve and Graph Inequalities
Quiz
•
6th Grade
15 questions
Distributive Property & Review
Quiz
•
6th Grade
10 questions
Mean, Median, Mode, and Range
Quiz
•
7th Grade