Organizing Measurement Data with Line Plots
Interactive Video
•
Mathematics
•
6th - 10th Grade
•
Practice Problem
•
Hard
+2
Standards-aligned

Amelia Wright
FREE Resource
Standards-aligned
Read more
10 questions
Show all answers
1.
MULTIPLE CHOICE QUESTION
30 sec • 1 pt
What is the length of the dwarf willow leaf?
2 centimeters
5 centimeters
3 centimeters
4 centimeters
Tags
CCSS.2.MD.A.3
2.
MULTIPLE CHOICE QUESTION
30 sec • 1 pt
How many leaves were measured to be four centimeters long?
None
Three
Two
One
Tags
CCSS.2.MD.A.3
3.
MULTIPLE CHOICE QUESTION
30 sec • 1 pt
What is the purpose of using a line plot?
To represent data as points above a line
To confuse the viewer
To draw pretty pictures
To make data collection harder
Tags
CCSS.2.MD.D.9
4.
MULTIPLE CHOICE QUESTION
30 sec • 1 pt
Which leaf length had no representation on the line plot?
2 centimeters
3 centimeters
5 centimeters
4 centimeters
Tags
CCSS.3.MD.B.4
5.
MULTIPLE CHOICE QUESTION
30 sec • 1 pt
What is the abbreviation for centimeter?
Centm
Ctm
Cm
C
Tags
CCSS.4.MD.A.1
6.
MULTIPLE CHOICE QUESTION
30 sec • 1 pt
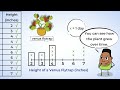
What unit was used to measure the height of the Venus Flytrap?
Inches
Millimeters
Meters
Centimeters
Tags
CCSS.2.MD.A.3
7.
MULTIPLE CHOICE QUESTION
30 sec • 1 pt
On which days did the Venus Flytrap measure six inches in height?
Days 5 and 6
Days 8 and 9
Days 6 and 7
Days 7 and 8
Tags
CCSS.2.MD.D.9
CCSS.3.MD.B.4
Access all questions and much more by creating a free account
Create resources
Host any resource
Get auto-graded reports
Continue with Google

Continue with Email
Continue with Classlink
Continue with Clever
or continue with
Microsoft
%20(1).png)
Apple
Others
Already have an account?
Popular Resources on Wayground

15 questions
Fractions on a Number Line
Quiz
•
3rd Grade
20 questions
Equivalent Fractions
Quiz
•
3rd Grade
25 questions
Multiplication Facts
Quiz
•
5th Grade
29 questions
Alg. 1 Section 5.1 Coordinate Plane
Quiz
•
9th Grade
22 questions
fractions
Quiz
•
3rd Grade
11 questions
FOREST Effective communication
Lesson
•
KG
20 questions
Main Idea and Details
Quiz
•
5th Grade
20 questions
Context Clues
Quiz
•
6th Grade
Discover more resources for Mathematics
29 questions
Alg. 1 Section 5.1 Coordinate Plane
Quiz
•
9th Grade
36 questions
6th Grade Math STAAR Review
Quiz
•
6th Grade
14 questions
Volume of rectangular prisms
Quiz
•
7th Grade
14 questions
finding slope from a graph
Quiz
•
8th Grade
20 questions
Graphing Inequalities on a Number Line
Quiz
•
6th - 9th Grade
23 questions
Solve and Graph Inequalities
Quiz
•
6th Grade
15 questions
Distributive Property & Review
Quiz
•
6th Grade
10 questions
Mean, Median, Mode, and Range
Quiz
•
7th Grade