Interpreting Pictographs and Bar Graphs
Interactive Video
•
Mathematics
•
6th - 10th Grade
•
Practice Problem
•
Medium
+1
Standards-aligned

Mia Campbell
Used 13+ times
FREE Resource
Standards-aligned
Read more
10 questions
Show all answers
1.
MULTIPLE CHOICE QUESTION
30 sec • 1 pt
What does the vertical axis in a bar graph represent?
Types of pets
Number of pets
Number of people
Types of graphs
Tags
CCSS.2.MD.D.10
2.
MULTIPLE CHOICE QUESTION
30 sec • 1 pt
What does the horizontal axis in a bar graph typically represent?
Number of items
Types of items
Quantity of sales
Days of the week
Tags
CCSS.2.MD.D.10
3.
MULTIPLE CHOICE QUESTION
30 sec • 1 pt
How many people own dogs according to the bar graph?
4
6
11
8
Tags
CCSS.3.MD.B.3
4.
MULTIPLE CHOICE QUESTION
30 sec • 1 pt
Which pet is owned by the highest number of people according to the bar graph?
Dogs
Rabbits
Cats
Goldfish
Tags
CCSS.2.MD.D.10
5.
MULTIPLE CHOICE QUESTION
30 sec • 1 pt
What is the main difference between a pictograph and a bar graph?
Pictographs use numbers
Bar graphs use pictures
Pictographs use pictures
Bar graphs have no legend
Tags
CCSS.2.MD.D.10
6.
MULTIPLE CHOICE QUESTION
30 sec • 1 pt
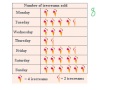
What does half an ice cream cone symbolize in the pictograph?
1 ice cream
2 ice creams
3 ice creams
4 ice creams
Tags
CCSS.3.MD.B.3
7.
MULTIPLE CHOICE QUESTION
30 sec • 1 pt
What is the purpose of the legend in a pictograph?
To count the items
To list the days
To explain the symbols
To show the title
Tags
CCSS.2.MD.D.10
Access all questions and much more by creating a free account
Create resources
Host any resource
Get auto-graded reports
Continue with Google

Continue with Email
Continue with Classlink
Continue with Clever
or continue with
Microsoft
%20(1).png)
Apple
Others
Already have an account?
