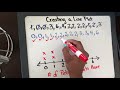
Data Representation and Analysis
Interactive Video
•
Mathematics, Education
•
4th - 8th Grade
•
Practice Problem
•
Hard
+7
Standards-aligned

Emma Peterson
FREE Resource
Standards-aligned
Read more
10 questions
Show all answers
1.
MULTIPLE CHOICE QUESTION
30 sec • 1 pt
What is a line plot?
A visual representation of data using a number line
A type of bar chart
A method to calculate averages
A way to organize text data
Tags
CCSS.RI.6.7
CCSS.RI.8.7
CCSS.RL.5.7
CCSS.RL.6.7
CCSS.RL.8.7
2.
MULTIPLE CHOICE QUESTION
30 sec • 1 pt
What was the survey about in the video?
Favorite subjects of students
Number of pets students have
Number of books read by students
Daily screen time of students
Tags
CCSS.3.MD.B.4
3.
MULTIPLE CHOICE QUESTION
30 sec • 1 pt
Why is it important to organize data from least to greatest before creating a line plot?
To calculate the average
To make it easier to draw the number line
To identify outliers
To find the median
Tags
CCSS.4.MD.B.4
4.
MULTIPLE CHOICE QUESTION
30 sec • 1 pt
What values should be included on the number line for the given data set?
0 to 5
1 to 6
0 to 6
1 to 5
Tags
CCSS.1.MD.C.4
5.
MULTIPLE CHOICE QUESTION
30 sec • 1 pt
How many students had zero pets?
Four
Three
One
Two
Tags
CCSS.1.MD.C.4
6.
MULTIPLE CHOICE QUESTION
30 sec • 1 pt
How many students had two pets?
Five
Six
Four
Three
Tags
CCSS.6.SP.B.4
CCSS.HSS.ID.A.1
7.
MULTIPLE CHOICE QUESTION
30 sec • 1 pt
What is the mode of the data set?
Zero
One
Three
Two
Tags
CCSS.6.SP.B.4
CCSS.HSS.ID.A.1
Access all questions and much more by creating a free account
Create resources
Host any resource
Get auto-graded reports
Continue with Google

Continue with Email
Continue with Classlink
Continue with Clever
or continue with
Microsoft
%20(1).png)
Apple
Others
Already have an account?
Popular Resources on Wayground

15 questions
Fractions on a Number Line
Quiz
•
3rd Grade
20 questions
Equivalent Fractions
Quiz
•
3rd Grade
25 questions
Multiplication Facts
Quiz
•
5th Grade
22 questions
fractions
Quiz
•
3rd Grade
20 questions
Main Idea and Details
Quiz
•
5th Grade
20 questions
Context Clues
Quiz
•
6th Grade
15 questions
Equivalent Fractions
Quiz
•
4th Grade
20 questions
Figurative Language Review
Quiz
•
6th Grade
Discover more resources for Mathematics
25 questions
Multiplication Facts
Quiz
•
5th Grade
15 questions
Equivalent Fractions
Quiz
•
4th Grade
20 questions
Exponents
Quiz
•
6th Grade
22 questions
distributive property
Quiz
•
7th Grade
10 questions
Multiplying Fractions
Quiz
•
5th Grade
15 questions
Distributive Property & Review
Quiz
•
6th Grade
77 questions
Mixed Multiplication and Division Facts
Quiz
•
4th Grade
20 questions
Writing Algebraic Expressions
Quiz
•
6th Grade