Understanding Bar Charts and Bar Graphs
Interactive Video
•
Mathematics, Education
•
4th - 8th Grade
•
Practice Problem
•
Medium
+3
Standards-aligned

Mia Campbell
Used 39+ times
FREE Resource
Standards-aligned
Read more
10 questions
Show all answers
1.
MULTIPLE CHOICE QUESTION
30 sec • 1 pt
What is the primary purpose of a bar chart or bar graph?
To display data in a circular format
To compare and contrast values in relation to each other
To show trends over time
To list items in alphabetical order
Tags
CCSS.2.MD.D.10
2.
MULTIPLE CHOICE QUESTION
30 sec • 1 pt
What is the first step in creating a bar graph from a data chart?
Label the horizontal axis
Choose a color scheme
Give the bar graph a title
Draw the bars
Tags
CCSS.2.MD.D.9
3.
MULTIPLE CHOICE QUESTION
30 sec • 1 pt
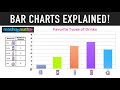
When labeling the vertical axis for the favorite drinks bar graph, what scale was used?
0 to 15
0 to 10
0 to 20
0 to 5
4.
MULTIPLE CHOICE QUESTION
30 sec • 1 pt
How many students chose milk as their favorite drink?
One
Seven
Three
Six
Tags
CCSS.2.MD.D.10
5.
MULTIPLE CHOICE QUESTION
30 sec • 1 pt
For the favorite drinks bar graph, how many students chose soda?
Five
Three
Seven
One
Tags
CCSS.HSN.Q.A.1
6.
MULTIPLE CHOICE QUESTION
30 sec • 1 pt
In the vegetable sales bar graph, what is the vertical axis range?
0 to 200
0 to 50
0 to 100
0 to 150
Tags
CCSS.3.MD.A.2
7.
MULTIPLE CHOICE QUESTION
30 sec • 1 pt
How many pounds of radishes were shipped according to the vegetable sales bar graph?
50
60
75
90
Tags
CCSS.3.MD.A.2
Access all questions and much more by creating a free account
Create resources
Host any resource
Get auto-graded reports
Continue with Google

Continue with Email
Continue with Classlink
Continue with Clever
or continue with
Microsoft
%20(1).png)
Apple
Others
Already have an account?
