Exploring the Constant of Proportionality in Graphs
Interactive Video
•
Mathematics
•
6th - 10th Grade
•
Practice Problem
•
Medium
+1
Standards-aligned

Lucas Foster
Used 8+ times
FREE Resource
Standards-aligned
Read more
10 questions
Show all answers
1.
MULTIPLE CHOICE QUESTION
30 sec • 1 pt
What is a characteristic feature of a direct proportion graph?
It is a curved line.
It never intersects the x-axis.
It passes through the origin (0,0).
It only increases in value.
Tags
CCSS.8.EE.B.5
2.
MULTIPLE CHOICE QUESTION
30 sec • 1 pt
How can you identify a graph as directly proportional?
The line goes through the point (1,1).
The graph represents exponential growth.
The line is horizontal.
The graph is a straight line through the origin.
Tags
CCSS.7.RP.A.2D
3.
MULTIPLE CHOICE QUESTION
30 sec • 1 pt
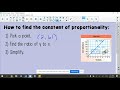
What is the first step in finding the constant of proportionality from a graph?
Calculate the slope of the graph.
Select any point on the graph.
Draw a tangent line at the origin.
Identify a point where the graph intersects grid lines.
Tags
CCSS.7.RP.A.2D
4.
MULTIPLE CHOICE QUESTION
30 sec • 1 pt
What does the constant of proportionality represent in a direct proportion?
The slope of the graph.
The difference between consecutive y-values.
The x-intercept of the graph.
The maximum value of y.
Tags
CCSS.7.RP.A.2B
5.
MULTIPLE CHOICE QUESTION
30 sec • 1 pt
How do you calculate the constant of proportionality from a graph?
Add the x and y values of a point.
Find the average of the x and y values of all points.
Divide the y-value by the x-value of a chosen point.
Multiply the x and y values of a point.
Tags
CCSS.7.RP.A.2B
6.
MULTIPLE CHOICE QUESTION
30 sec • 1 pt
What equation form is used to represent a direct proportion?
y = k/x
y = kx
y = k + x
y = x/k
Tags
CCSS.7.RP.A.2C
7.
MULTIPLE CHOICE QUESTION
30 sec • 1 pt
In the context of direct proportions, what does 'k' stand for?
The variable on the x-axis.
The variable on the y-axis.
The constant of proportionality.
The slope of the y-axis.
Tags
CCSS.7.RP.A.2B
Access all questions and much more by creating a free account
Create resources
Host any resource
Get auto-graded reports
Continue with Google

Continue with Email
Continue with Classlink
Continue with Clever
or continue with
Microsoft
%20(1).png)
Apple
Others
Already have an account?
