Creating and Interpreting Box Plots
Interactive Video
•
English
•
6th - 8th Grade
•
Practice Problem
•
Hard
Standards-aligned

Amelia Wright
Used 4+ times
FREE Resource
Standards-aligned
Read more
10 questions
Show all answers
1.
MULTIPLE CHOICE QUESTION
30 sec • 1 pt
What is another name for a box plot?
Histogram
Pie chart
Bar graph
Box and whisker plot
Tags
CCSS.6.SP.B.4
CCSS.HSS.ID.A.1
2.
MULTIPLE CHOICE QUESTION
30 sec • 1 pt
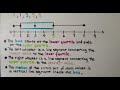
What does the line segment connecting the lowest value to the lower quartile represent?
Lower whisker
Box line
Upper whisker
Median line
Tags
CCSS.6.SP.B.4
CCSS.HSS.ID.A.1
3.
MULTIPLE CHOICE QUESTION
30 sec • 1 pt
How many students were surveyed about their pets for the box plot example?
Nine
Eight
Ten
Seven
Tags
CCSS.6.SP.B.4
CCSS.HSS.ID.A.1
4.
MULTIPLE CHOICE QUESTION
30 sec • 1 pt
What is the median number of pets owned as per the data?
Five
Three
Four
Two
Tags
CCSS.6.SP.B.5C
5.
MULTIPLE CHOICE QUESTION
30 sec • 1 pt
What value does the upper quartile represent in the box plot?
The highest value in the data set
The average of all data points
The median of the lower half of the data
The median of the upper half of the data
Tags
CCSS.6.SP.B.4
CCSS.HSS.ID.A.1
6.
MULTIPLE CHOICE QUESTION
30 sec • 1 pt
What is the lower quartile value in the example?
One
Zero
Two
Three
Tags
CCSS.6.SP.B.5C
7.
MULTIPLE CHOICE QUESTION
30 sec • 1 pt
How is the median found when there is an even number of data values?
By averaging the two middle numbers
By multiplying the two middle numbers
By selecting the lowest middle number
By selecting the highest middle number
Tags
CCSS.6.SP.B.5C
Access all questions and much more by creating a free account
Create resources
Host any resource
Get auto-graded reports
Continue with Google

Continue with Email
Continue with Classlink
Continue with Clever
or continue with
Microsoft
%20(1).png)
Apple
Others
Already have an account?
Popular Resources on Wayground

7 questions
History of Valentine's Day
Interactive video
•
4th Grade
15 questions
Fractions on a Number Line
Quiz
•
3rd Grade
20 questions
Equivalent Fractions
Quiz
•
3rd Grade
25 questions
Multiplication Facts
Quiz
•
5th Grade
22 questions
fractions
Quiz
•
3rd Grade
15 questions
Valentine's Day Trivia
Quiz
•
3rd Grade
20 questions
Main Idea and Details
Quiz
•
5th Grade
20 questions
Context Clues
Quiz
•
6th Grade
Discover more resources for English
20 questions
Context Clues
Quiz
•
6th Grade
10 questions
Exploring Valentine's Day with Charlie Brown
Interactive video
•
6th - 10th Grade
20 questions
Figurative Language Review
Quiz
•
6th Grade
25 questions
7th Reading STAAR Vocabulary
Quiz
•
6th - 8th Grade
20 questions
Revising & Editing practice
Quiz
•
7th Grade
20 questions
Main Idea and Supporting Details
Quiz
•
7th Grade
24 questions
7th grade STAAR Reading Review
Quiz
•
7th Grade
15 questions
Theme
Lesson
•
3rd - 7th Grade