Exploring Measures of Central Tendency and Variability
Interactive Video
•
Mathematics
•
6th - 8th Grade
•
Practice Problem
•
Hard
+2
Standards-aligned

Mia Campbell
Used 2+ times
FREE Resource
Standards-aligned
Read more
10 questions
Show all answers
1.
MULTIPLE CHOICE QUESTION
30 sec • 1 pt
What statistical measure is typically discussed most often?
Median
Range
Mode
Mean
Tags
CCSS.6.SP.A.3
2.
MULTIPLE CHOICE QUESTION
30 sec • 1 pt
Which measure should be used if the data set includes an outlier?
Median
Mean
Range
Mode
Tags
CCSS.6.SP.B.5D
CCSS.HSS.ID.A.2
3.
MULTIPLE CHOICE QUESTION
30 sec • 1 pt
In what scenario is mode the best descriptor of data?
All numerical data
Numerical data with outliers
Data without outliers
Non-numerical data
Tags
CCSS.6.SP.B.5D
CCSS.HSS.ID.A.2
4.
MULTIPLE CHOICE QUESTION
30 sec • 1 pt
What does an outlier in a data set typically influence?
The range
The median
The mode
The mean
5.
MULTIPLE CHOICE QUESTION
30 sec • 1 pt
In the provided example, why is the median preferred over the mean?
Because it is lower
Because it excludes the outlier
Because it is higher
Because it represents the data more accurately
Tags
CCSS.6.SP.B.5D
CCSS.HSS.ID.A.2
6.
MULTIPLE CHOICE QUESTION
30 sec • 1 pt
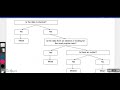
According to the flowchart, what should be considered if the data is numerical?
If it includes an outlier
Both A and B
If it is from an election
If it is popular
Tags
CCSS.6.SP.B.4
CCSS.HSS.ID.A.1
7.
MULTIPLE CHOICE QUESTION
30 sec • 1 pt
What is the correct measure when data is not numerical?
Mean
Median
Mode
Range
Tags
CCSS.6.SP.B.5D
CCSS.HSS.ID.A.2
Access all questions and much more by creating a free account
Create resources
Host any resource
Get auto-graded reports
Continue with Google

Continue with Email
Continue with Classlink
Continue with Clever
or continue with
Microsoft
%20(1).png)
Apple
Others
Already have an account?
