Exploring Graphing Ordered Pairs and Averages
Interactive Video
•
Mathematics
•
1st - 5th Grade
•
Practice Problem
•
Hard
+10
Standards-aligned

Lucas Foster
FREE Resource
Standards-aligned
Read more
10 questions
Show all answers
1.
MULTIPLE CHOICE QUESTION
30 sec • 1 pt
What unusual event happened to Mr. Tadpole in the video?
He learned a new math concept
He was transformed into a frog
He underwent a reverse metamorphosis due to a time warp
He won a mathematics award
Tags
CCSS.RI.1.1
CCSS.RI.3.1
CCSS.RL.1.1
CCSS.RL.2.1
CCSS.RL.3.1
2.
MULTIPLE CHOICE QUESTION
30 sec • 1 pt
What is the rule identified for adding boxes in the figures?
Multiply by two
Add two boxes
Add three boxes
Subtract two boxes
Tags
CCSS.1.G.A.1
CCSS.2.G.A.1
3.
MULTIPLE CHOICE QUESTION
30 sec • 1 pt
How many additional boxes are there from Figure 1 to Figure 2?
Three boxes
Two boxes
Four boxes
One box
Tags
CCSS.3.MD.A.2
4.
MULTIPLE CHOICE QUESTION
30 sec • 1 pt
What coordinates represent the location of the clock tower?
(4, 2)
(2, 4)
(1, 3)
(3, 1)
Tags
CCSS.5.G.A.2
5.
MULTIPLE CHOICE QUESTION
30 sec • 1 pt
What ordered pair correctly identifies the art museum's location?
(4, 1)
(1, 4)
(2, 4)
(3, 2)
Tags
CCSS.5.G.A.2
6.
MULTIPLE CHOICE QUESTION
30 sec • 1 pt
What does the coordinate (1, 3) represent in the context of the video?
Location of a school
Location of a train station
Location of a clock tower
Location of an art museum
Tags
CCSS.5.G.A.2
7.
MULTIPLE CHOICE QUESTION
30 sec • 1 pt
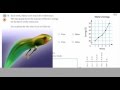
Which week showed the greatest increase in Maria's savings?
Week 1 to Week 2
Week 2 to Week 3
Week 3 to Week 4
Week 4 to Week 5
Tags
CCSS.6.NS.C.7A
CCSS.6.NS.C.7B
Access all questions and much more by creating a free account
Create resources
Host any resource
Get auto-graded reports
Continue with Google

Continue with Email
Continue with Classlink
Continue with Clever
or continue with
Microsoft
%20(1).png)
Apple
Others
Already have an account?
Similar Resources on Wayground

11 questions
Learning to Tell Time Using a Calendar
Interactive video
•
1st - 3rd Grade
4 questions
Organizing Ideas for Effective Writing
Interactive video
•
1st - 6th Grade
3 questions
Elementary gymnastics - Floor mats - 7 side box jumps
Interactive video
•
1st - 6th Grade
8 questions
Selecting the Most Appropriate Measurement Conversions
Interactive video
•
1st - 6th Grade
11 questions
Solving Multi-Step Multiplication Word Problems
Interactive video
•
1st - 5th Grade
11 questions
Exploring Graphing Ordered Pairs and Line Plots
Interactive video
•
1st - 5th Grade
11 questions
Exploring Coordinate Grids in EDM 4.7
Interactive video
•
1st - 5th Grade
9 questions
Healthy Lifestyle Choices Assessment
Interactive video
•
1st - 5th Grade
Popular Resources on Wayground
7 questions
History of Valentine's Day
Interactive video
•
4th Grade
15 questions
Fractions on a Number Line
Quiz
•
3rd Grade
20 questions
Equivalent Fractions
Quiz
•
3rd Grade
25 questions
Multiplication Facts
Quiz
•
5th Grade
22 questions
fractions
Quiz
•
3rd Grade
15 questions
Valentine's Day Trivia
Quiz
•
3rd Grade
20 questions
Main Idea and Details
Quiz
•
5th Grade
20 questions
Context Clues
Quiz
•
6th Grade
Discover more resources for Mathematics
15 questions
Fractions on a Number Line
Quiz
•
3rd Grade
20 questions
Equivalent Fractions
Quiz
•
3rd Grade
25 questions
Multiplication Facts
Quiz
•
5th Grade
22 questions
fractions
Quiz
•
3rd Grade
15 questions
Equivalent Fractions
Quiz
•
4th Grade
18 questions
Comparing Fractions with same numerator or denominator
Quiz
•
3rd Grade
20 questions
Classifying Triangles
Quiz
•
5th Grade
10 questions
Area
Quiz
•
3rd Grade