Exploring Data Interpretation with Graphs
Interactive Video
•
Mathematics
•
1st - 5th Grade
•
Practice Problem
•
Medium
+2
Standards-aligned

Lucas Foster
Used 9+ times
FREE Resource
Standards-aligned
Read more
10 questions
Show all answers
1.
MULTIPLE CHOICE QUESTION
30 sec • 1 pt
What does a survey typically involve?
Observing behaviors without interaction
Conducting experiments in controlled environments
Discussing topics without recording responses
Asking a question to a large group and collecting data
2.
MULTIPLE CHOICE QUESTION
30 sec • 1 pt
What does one happy face symbol represent in the pet ownership graph?
One pet owned by a person
Four pets owned by a person
Two pets owned by a person
Three pets owned by a person
3.
MULTIPLE CHOICE QUESTION
30 sec • 1 pt
Which pet is the most common among the surveyed group?
Fish
Bird
Cat
Dog
Tags
CCSS.1.MD.C.4
4.
MULTIPLE CHOICE QUESTION
30 sec • 1 pt
What is the purpose of the key in a picture graph?
To explain what the symbols represent
To provide the names of all respondents
To show the number of questions asked
To list all possible answers
Tags
CCSS.2.MD.D.10
5.
MULTIPLE CHOICE QUESTION
30 sec • 1 pt
How many people were surveyed about their last vacation type?
30 people
20 people
15 people
25 people
Tags
CCSS.6.SP.B.5A
6.
MULTIPLE CHOICE QUESTION
30 sec • 1 pt
How many more people went to a city than to the countryside for vacation?
4 people
3 people
5 people
2 people
7.
MULTIPLE CHOICE QUESTION
30 sec • 1 pt
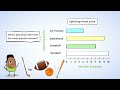
Which subject had the highest number of teachers preferring to teach it?
Math
Science
History
English
Access all questions and much more by creating a free account
Create resources
Host any resource
Get auto-graded reports
Continue with Google

Continue with Email
Continue with Classlink
Continue with Clever
or continue with
Microsoft
%20(1).png)
Apple
Others
Already have an account?
Popular Resources on Wayground

15 questions
Fractions on a Number Line
Quiz
•
3rd Grade
20 questions
Equivalent Fractions
Quiz
•
3rd Grade
25 questions
Multiplication Facts
Quiz
•
5th Grade
22 questions
fractions
Quiz
•
3rd Grade
20 questions
Main Idea and Details
Quiz
•
5th Grade
20 questions
Context Clues
Quiz
•
6th Grade
15 questions
Equivalent Fractions
Quiz
•
4th Grade
20 questions
Figurative Language Review
Quiz
•
6th Grade
Discover more resources for Mathematics
15 questions
Fractions on a Number Line
Quiz
•
3rd Grade
20 questions
Equivalent Fractions
Quiz
•
3rd Grade
25 questions
Multiplication Facts
Quiz
•
5th Grade
22 questions
fractions
Quiz
•
3rd Grade
15 questions
Equivalent Fractions
Quiz
•
4th Grade
10 questions
Area
Quiz
•
3rd Grade
20 questions
Identifying Fractions
Quiz
•
3rd Grade
10 questions
Multiplying Fractions
Quiz
•
5th Grade