Decoding Bar Graphs: Scale and Survey Insights
Interactive Video
•
Mathematics
•
1st - 5th Grade
•
Practice Problem
•
Hard
+5
Standards-aligned

Ethan Morris
FREE Resource
Standards-aligned
Read more
10 questions
Show all answers
1.
MULTIPLE CHOICE QUESTION
30 sec • 1 pt
What is the first step in analyzing data from a bar graph?
Identify the highest bar
Determine the scale
Find the average value
Count the number of bars
Tags
CCSS.2.MD.D.9
2.
MULTIPLE CHOICE QUESTION
30 sec • 1 pt
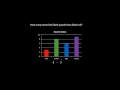
If the bar for green reaches up to 8 on the scale, how many students chose green as their favorite color?
4 students
8 students
16 students
2 students
Tags
CCSS.2.MD.D.10
3.
MULTIPLE CHOICE QUESTION
30 sec • 1 pt
Which color was the least popular among the students?
Blue
Red
Green
Purple
Tags
CCSS.7.EE.B.3
4.
MULTIPLE CHOICE QUESTION
30 sec • 1 pt
What is the difference in popularity between the most and least popular colors?
9 students
6 students
5 students
3 students
Tags
CCSS.8.SP.A.4
5.
MULTIPLE CHOICE QUESTION
30 sec • 1 pt
How many students liked purple more than red?
12 students
3 students
6 students
9 students
Tags
CCSS.6.SP.B.5A
6.
MULTIPLE CHOICE QUESTION
30 sec • 1 pt
How many students were surveyed about their favorite color?
26 students
24 students
28 students
30 students
Tags
CCSS.HSN.Q.A.1
7.
MULTIPLE CHOICE QUESTION
30 sec • 1 pt
What scale is used in the bar graph about pets?
Counting by 3s
Counting by 2s
Counting by 10s
Counting by 5s
Access all questions and much more by creating a free account
Create resources
Host any resource
Get auto-graded reports
Continue with Google

Continue with Email
Continue with Classlink
Continue with Clever
or continue with
Microsoft
%20(1).png)
Apple
Others
Already have an account?
Popular Resources on Wayground

7 questions
History of Valentine's Day
Interactive video
•
4th Grade
15 questions
Fractions on a Number Line
Quiz
•
3rd Grade
20 questions
Equivalent Fractions
Quiz
•
3rd Grade
25 questions
Multiplication Facts
Quiz
•
5th Grade
22 questions
fractions
Quiz
•
3rd Grade
15 questions
Valentine's Day Trivia
Quiz
•
3rd Grade
20 questions
Main Idea and Details
Quiz
•
5th Grade
20 questions
Context Clues
Quiz
•
6th Grade
Discover more resources for Mathematics
15 questions
Fractions on a Number Line
Quiz
•
3rd Grade
20 questions
Equivalent Fractions
Quiz
•
3rd Grade
25 questions
Multiplication Facts
Quiz
•
5th Grade
22 questions
fractions
Quiz
•
3rd Grade
15 questions
Equivalent Fractions
Quiz
•
4th Grade
18 questions
Comparing Fractions with same numerator or denominator
Quiz
•
3rd Grade
20 questions
Classifying Triangles
Quiz
•
5th Grade
10 questions
Area
Quiz
•
3rd Grade