Understanding Bar Graphs and Data Interpretation
Interactive Video
•
Mathematics, Education
•
4th - 6th Grade
•
Practice Problem
•
Medium

Emma Peterson
Used 4+ times
FREE Resource
Read more
10 questions
Show all answers
1.
MULTIPLE CHOICE QUESTION
30 sec • 1 pt
What is the purpose of the scale in a bar graph?
To indicate the title
To show the intervals
To measure the values
To label the bars
2.
MULTIPLE CHOICE QUESTION
30 sec • 1 pt
Which part of a bar graph shows the distance between values?
Title
Intervals
Labels
Bars
3.
MULTIPLE CHOICE QUESTION
30 sec • 1 pt
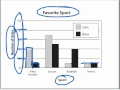
In the double bar graph example, which sport is equally favored by both boys and girls?
Basketball
Baseball
Soccer
Tennis
4.
MULTIPLE CHOICE QUESTION
30 sec • 1 pt
How can you tell that tennis is equally favored by boys and girls in the example?
The bars for tennis are the shortest
The bars for tennis are different colors
The bars for tennis are equal in height
The bars for tennis are the tallest
5.
MULTIPLE CHOICE QUESTION
30 sec • 1 pt
Why is a key important in a double bar graph?
To indicate the title
To label the bars
To differentiate between the two groups
To show the intervals
6.
MULTIPLE CHOICE QUESTION
30 sec • 1 pt
What should you notice about the bars for boys and girls in each sport?
They are far apart
They are different colors
They are close together
They are the same height
7.
MULTIPLE CHOICE QUESTION
30 sec • 1 pt
What do bar graphs typically show?
Changes over time
Amounts like how many or how much
Relationships between variables
Trends and patterns
Access all questions and much more by creating a free account
Create resources
Host any resource
Get auto-graded reports
Continue with Google

Continue with Email
Continue with Classlink
Continue with Clever
or continue with
Microsoft
%20(1).png)
Apple
Others
Already have an account?
Popular Resources on Wayground

7 questions
History of Valentine's Day
Interactive video
•
4th Grade
15 questions
Fractions on a Number Line
Quiz
•
3rd Grade
20 questions
Equivalent Fractions
Quiz
•
3rd Grade
25 questions
Multiplication Facts
Quiz
•
5th Grade
22 questions
fractions
Quiz
•
3rd Grade
15 questions
Valentine's Day Trivia
Quiz
•
3rd Grade
20 questions
Main Idea and Details
Quiz
•
5th Grade
20 questions
Context Clues
Quiz
•
6th Grade
Discover more resources for Mathematics
25 questions
Multiplication Facts
Quiz
•
5th Grade
15 questions
Equivalent Fractions
Quiz
•
4th Grade
20 questions
Classifying Triangles
Quiz
•
5th Grade
14 questions
Fractions to Decimals & Decimals to Fractions
Quiz
•
4th Grade
10 questions
Multiplying Fractions
Quiz
•
5th Grade
77 questions
Mixed Multiplication and Division Facts
Quiz
•
4th Grade
20 questions
Writing Algebraic Expressions
Quiz
•
6th Grade
10 questions
Data Collection
Quiz
•
4th Grade