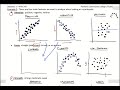
Analyzing Scatterplots and Trends
Interactive Video
•
Mathematics, Science
•
9th - 12th Grade
•
Practice Problem
•
Medium

Olivia Brooks
Used 14+ times
FREE Resource
Read more
10 questions
Show all answers
1.
MULTIPLE CHOICE QUESTION
30 sec • 1 pt
What are the two main aspects to describe in a scatterplot?
Size and density
Height and width
Direction and strength
Color and shape
2.
MULTIPLE CHOICE QUESTION
30 sec • 1 pt
In a scatterplot, what does a positive direction indicate?
As x increases, y remains constant
As x increases, y increases
As x increases, y decreases
As x decreases, y increases
3.
MULTIPLE CHOICE QUESTION
30 sec • 1 pt
What does a scatterplot with no clear trend typically look like?
A curve
A blob
A zigzag pattern
A straight line
4.
MULTIPLE CHOICE QUESTION
30 sec • 1 pt
Why is it important to ensure a linear form in scatterplot analysis?
To make the graph look neat
To avoid using complex software
To use a ruler for drawing
To apply linear regression techniques
5.
MULTIPLE CHOICE QUESTION
30 sec • 1 pt
What is the best predictor for y when there is no clear trend in the scatterplot?
The median y value
The average y value
The highest y value
The lowest y value
6.
MULTIPLE CHOICE QUESTION
30 sec • 1 pt
What does a strong scatterplot indicate about the data points?
They are randomly scattered
They are far from the line of best fit
They form a perfect circle
They are close to the line of best fit
7.
MULTIPLE CHOICE QUESTION
30 sec • 1 pt
How does a moderate scatterplot differ from a strong one?
Data points are in a zigzag pattern
Data points form a perfect line
Data points are closer to the line
Data points are more spread out
Access all questions and much more by creating a free account
Create resources
Host any resource
Get auto-graded reports
Continue with Google

Continue with Email
Continue with Classlink
Continue with Clever
or continue with
Microsoft
%20(1).png)
Apple
Others
Already have an account?
Popular Resources on Wayground

15 questions
Fractions on a Number Line
Quiz
•
3rd Grade
10 questions
Probability Practice
Quiz
•
4th Grade
15 questions
Probability on Number LIne
Quiz
•
4th Grade
20 questions
Equivalent Fractions
Quiz
•
3rd Grade
25 questions
Multiplication Facts
Quiz
•
5th Grade
22 questions
fractions
Quiz
•
3rd Grade
6 questions
Appropriate Chromebook Usage
Lesson
•
7th Grade
10 questions
Greek Bases tele and phon
Quiz
•
6th - 8th Grade
Discover more resources for Mathematics
23 questions
TSI Math Vocabulary
Quiz
•
10th - 12th Grade
15 questions
Graphing Inequalities
Quiz
•
7th - 9th Grade
20 questions
Graphing Inequalities on a Number Line
Quiz
•
6th - 9th Grade
15 questions
Combine Like Terms and Distributive Property
Quiz
•
8th - 9th Grade
10 questions
Plotting Points on a Coordinate Plane: Quadrant 1 Essentials
Interactive video
•
6th - 10th Grade
20 questions
Perfect Squares and Square Roots
Quiz
•
9th Grade
80 questions
ACT Math Important Vocabulary
Quiz
•
11th Grade
10 questions
Exploring Abiotic and Biotic Factors in Ecosystems
Interactive video
•
6th - 10th Grade