Exploring Probability in Normal Distributions
Interactive Video
•
Mathematics
•
6th - 10th Grade
•
Practice Problem
•
Medium
Standards-aligned

Liam Anderson
Used 3+ times
FREE Resource
Standards-aligned
Read more
10 questions
Show all answers
1.
MULTIPLE CHOICE QUESTION
30 sec • 1 pt
Main goal of section 5.2 in chapter 5?
Understand finding probabilities in normal distributions
Compare normal distributions with other types
Learn about mean and standard deviation
Study history of normal distributions
2.
MULTIPLE CHOICE QUESTION
30 sec • 1 pt
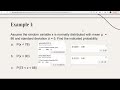
Unusual probability in normal distribution?
More than 0.95
Exactly 0.5
Less than 0.05
Greater than 0.05
Tags
CCSS.HSS.ID.A.4
3.
MULTIPLE CHOICE QUESTION
30 sec • 1 pt
Probability of variable X in a specific interval?
Area of the interval
Standard deviation
Mean of the distribution
Height of the distribution curve
Tags
CCSS.7.SP.C.7B
4.
MULTIPLE CHOICE QUESTION
30 sec • 1 pt
How to find area in Desmos for normal distribution?
Calculate the mean
Set min and max values
Determine standard deviation
Measure the curve's peak
5.
MULTIPLE CHOICE QUESTION
30 sec • 1 pt
Cumulative probability function in Desmos helps to find?
Area under the curve
Mean of the distribution
Standard deviation
Peak of the curve
6.
MULTIPLE CHOICE QUESTION
30 sec • 1 pt
Relationship between area and probability in normal distribution?
Inversely related
Directly proportional
Represent the same concept
No relationship
7.
MULTIPLE CHOICE QUESTION
30 sec • 1 pt
Probability of being less than 78 with mean 86 and standard deviation 5?
21.19%
65.08%
4.32%
5.48%
Tags
CCSS.HSS.ID.A.4
Access all questions and much more by creating a free account
Create resources
Host any resource
Get auto-graded reports
Continue with Google

Continue with Email
Continue with Classlink
Continue with Clever
or continue with
Microsoft
%20(1).png)
Apple
Others
Already have an account?
Similar Resources on Wayground
Popular Resources on Wayground

15 questions
Fractions on a Number Line
Quiz
•
3rd Grade
20 questions
Equivalent Fractions
Quiz
•
3rd Grade
25 questions
Multiplication Facts
Quiz
•
5th Grade
54 questions
Analyzing Line Graphs & Tables
Quiz
•
4th Grade
22 questions
fractions
Quiz
•
3rd Grade
20 questions
Main Idea and Details
Quiz
•
5th Grade
20 questions
Context Clues
Quiz
•
6th Grade
15 questions
Equivalent Fractions
Quiz
•
4th Grade
Discover more resources for Mathematics
22 questions
distributive property
Quiz
•
7th Grade
18 questions
Angle Relationships
Quiz
•
7th Grade
15 questions
Distributive Property & Review
Quiz
•
6th Grade
20 questions
Writing Algebraic Expressions
Quiz
•
6th Grade
20 questions
How Some Friendships Last — and Others Don’t Video Questions
Quiz
•
7th Grade
14 questions
finding slope from a graph
Quiz
•
8th Grade
20 questions
Ratios/Rates and Unit Rates
Quiz
•
6th Grade
18 questions
Handbook Refresher Quiz
Quiz
•
7th Grade