Interpreting Two-Way Tables in Statistics
Interactive Video
•
Mathematics
•
6th - 10th Grade
•
Practice Problem
•
Hard
Standards-aligned

Jackson Turner
FREE Resource
Standards-aligned
10 questions
Show all answers
1.
MULTIPLE CHOICE QUESTION
30 sec • 1 pt
What does a two-way table represent?
Only numerical data
Data for a single category
Data for three different categories
Data that applies to two different categories
Tags
CCSS.8.SP.A.4
2.
MULTIPLE CHOICE QUESTION
30 sec • 1 pt
How many people were surveyed about scuba diving and skydiving?
70 people
50 people
40 people
60 people
Tags
CCSS.8.SP.A.4
3.
MULTIPLE CHOICE QUESTION
30 sec • 1 pt
How many people had not been scuba diving?
13 people
17 people
23 people
27 people
Tags
CCSS.8.SP.A.4
4.
MULTIPLE CHOICE QUESTION
30 sec • 1 pt
How many people had been both scuba diving and skydiving?
17 people
10 people
20 people
3 people
Tags
CCSS.8.SP.A.4
5.
MULTIPLE CHOICE QUESTION
30 sec • 1 pt
How many people had been skydiving but not scuba diving?
3 people
17 people
14 people
20 people
Tags
CCSS.HSS.CP.A.1
6.
MULTIPLE CHOICE QUESTION
30 sec • 1 pt
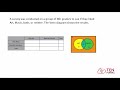
What does the blue area in the Venn diagram represent?
Students who only like art
Students who like neither art nor music
Students who only like music
Students who like both art and music
Tags
CCSS.HSS.CP.A.1
7.
MULTIPLE CHOICE QUESTION
30 sec • 1 pt
How many students like art only, according to the Venn diagram?
31 students
12 students
10 students
3 students
Tags
CCSS.HSS.CP.A.1
Access all questions and much more by creating a free account
Create resources
Host any resource
Get auto-graded reports
Continue with Google

Continue with Email
Continue with Classlink
Continue with Clever
or continue with
Microsoft
%20(1).png)
Apple
Others
Already have an account?
Popular Resources on Wayground

8 questions
2 Step Word Problems
Quiz
•
KG - University
20 questions
Comparing Fractions
Quiz
•
4th Grade
15 questions
Fractions on a Number Line
Quiz
•
3rd Grade
20 questions
Equivalent Fractions
Quiz
•
3rd Grade
25 questions
Multiplication Facts
Quiz
•
5th Grade
10 questions
Latin Bases claus(clois,clos, clud, clus) and ped
Quiz
•
6th - 8th Grade
22 questions
fractions
Quiz
•
3rd Grade
7 questions
The Story of Books
Quiz
•
6th - 8th Grade
Discover more resources for Mathematics
8 questions
2 Step Word Problems
Quiz
•
KG - University
22 questions
distributive property
Quiz
•
7th Grade
20 questions
Slope from a Graph
Quiz
•
8th Grade
15 questions
Distributive Property & Review
Quiz
•
6th Grade
20 questions
Ratios/Rates and Unit Rates
Quiz
•
6th Grade
18 questions
Graphing Inequalities on a Number Line
Quiz
•
6th Grade
20 questions
Laws of Exponents
Quiz
•
8th Grade
10 questions
Unit Rate
Quiz
•
6th Grade