Understanding Line Plots
Interactive Video
•
Mathematics, Education
•
4th - 8th Grade
•
Practice Problem
•
Medium
+2
Standards-aligned

Mia Campbell
Used 1+ times
FREE Resource
Standards-aligned
Read more
10 questions
Show all answers
1.
MULTIPLE CHOICE QUESTION
30 sec • 1 pt
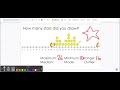
What was the unique challenge students faced while drawing stars?
Drawing stars with a specific pattern
Drawing only the outline of stars
Drawing stars with a specific size
Drawing stars with a specific color
Tags
CCSS.2.MD.D.9
2.
MULTIPLE CHOICE QUESTION
30 sec • 1 pt
What is the maximum number of stars drawn by a student?
10 stars
16 stars
26 stars
20 stars
Tags
CCSS.6.SP.B.4
CCSS.HSS.ID.A.1
3.
MULTIPLE CHOICE QUESTION
30 sec • 1 pt
How do you calculate the range of the data set?
Add the maximum and minimum values
Divide the maximum value by the minimum value
Subtract the minimum value from the maximum value
Multiply the maximum and minimum values
Tags
CCSS.6.SP.B.5C
4.
MULTIPLE CHOICE QUESTION
30 sec • 1 pt
What is the median in a data set?
The difference between the highest and lowest numbers
The most frequently occurring number
The average of all numbers
The middle number when arranged in order
Tags
CCSS.6.SP.B.5C
5.
MULTIPLE CHOICE QUESTION
30 sec • 1 pt
If two numbers are left in the middle when finding the median, what should you do?
Ignore them
Choose the smaller number
Choose the larger number
Add them and divide by two
Tags
CCSS.6.SP.A.3
6.
MULTIPLE CHOICE QUESTION
30 sec • 1 pt
What is the mode of the data set?
The average of all numbers
The number that appears most frequently
The highest number in the data set
The lowest number in the data set
Tags
CCSS.2.MD.D.9
7.
MULTIPLE CHOICE QUESTION
30 sec • 1 pt
Which number was the mode in the star-drawing activity?
16
26
12
10
Access all questions and much more by creating a free account
Create resources
Host any resource
Get auto-graded reports
Continue with Google

Continue with Email
Continue with Classlink
Continue with Clever
or continue with
Microsoft
%20(1).png)
Apple
Others
Already have an account?
Similar Resources on Wayground
Popular Resources on Wayground

7 questions
History of Valentine's Day
Interactive video
•
4th Grade
15 questions
Fractions on a Number Line
Quiz
•
3rd Grade
20 questions
Equivalent Fractions
Quiz
•
3rd Grade
25 questions
Multiplication Facts
Quiz
•
5th Grade
22 questions
fractions
Quiz
•
3rd Grade
15 questions
Valentine's Day Trivia
Quiz
•
3rd Grade
20 questions
Main Idea and Details
Quiz
•
5th Grade
20 questions
Context Clues
Quiz
•
6th Grade
Discover more resources for Mathematics
25 questions
Multiplication Facts
Quiz
•
5th Grade
15 questions
Equivalent Fractions
Quiz
•
4th Grade
20 questions
Classifying Triangles
Quiz
•
5th Grade
14 questions
Fractions to Decimals & Decimals to Fractions
Quiz
•
4th Grade
10 questions
Multiplying Fractions
Quiz
•
5th Grade
77 questions
Mixed Multiplication and Division Facts
Quiz
•
4th Grade
20 questions
Writing Algebraic Expressions
Quiz
•
6th Grade
10 questions
Data Collection
Quiz
•
4th Grade