Double Bar Graphs Quiz
Interactive Video
•
Mathematics, Education
•
4th - 6th Grade
•
Practice Problem
•
Easy

Sophia Harris
Used 1+ times
FREE Resource
Read more
10 questions
Show all answers
1.
MULTIPLE CHOICE QUESTION
30 sec • 1 pt
What is the main focus of lesson three?
Learning about line graphs
Constructing double bar graphs
Constructing pie charts
Understanding scatter plots
2.
MULTIPLE CHOICE QUESTION
30 sec • 1 pt
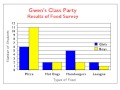
What types of food were included in Gwen's survey?
Pizza, sandwiches, tacos, and pasta
Hot dogs, nachos, pizza, and sushi
Pizza, hot dogs, hamburgers, and lasagna
Burgers, fries, pizza, and salad
3.
MULTIPLE CHOICE QUESTION
30 sec • 1 pt
How did Gwen divide the survey data?
By age group
By gender
By food preference
By class section
4.
MULTIPLE CHOICE QUESTION
30 sec • 1 pt
What is placed on the horizontal axis of the double bar graph?
Number of students
Types of food
Days of the week
Classroom activities
5.
MULTIPLE CHOICE QUESTION
30 sec • 1 pt
What is the purpose of the legend in the double bar graph?
To show the graph's title
To display the total number of students
To indicate the scale of the graph
To differentiate between boys' and girls' choices
6.
MULTIPLE CHOICE QUESTION
30 sec • 1 pt
Which color represented the girls' choices in the graph?
Blue
Red
Green
Yellow
7.
MULTIPLE CHOICE QUESTION
30 sec • 1 pt
What was the most popular food choice among boys?
Lasagna
Hamburgers
Hot dogs
Pizza
Access all questions and much more by creating a free account
Create resources
Host any resource
Get auto-graded reports
Continue with Google

Continue with Email
Continue with Classlink
Continue with Clever
or continue with
Microsoft
%20(1).png)
Apple
Others
Already have an account?
Similar Resources on Wayground

8 questions
Dinner Hall | POEM
Interactive video
•
KG - 6th Grade
6 questions
WAVES Practice Bowling Lessons With Andy Varipapa
Interactive video
•
6th - 7th Grade
6 questions
CLEAN : In Bordeaux, patrols remind young revellers to respect social distancing and barrier gestures
Interactive video
•
6th - 7th Grade
6 questions
Kevin Alejandro greets fans at the True Blood Seas
Interactive video
•
3rd - 5th Grade
3 questions
Graphically Representing Data with Histograms
Interactive video
•
1st - 6th Grade
Popular Resources on Wayground
15 questions
Fractions on a Number Line
Quiz
•
3rd Grade
20 questions
Equivalent Fractions
Quiz
•
3rd Grade
25 questions
Multiplication Facts
Quiz
•
5th Grade
29 questions
Alg. 1 Section 5.1 Coordinate Plane
Quiz
•
9th Grade
22 questions
fractions
Quiz
•
3rd Grade
11 questions
FOREST Effective communication
Lesson
•
KG
20 questions
Main Idea and Details
Quiz
•
5th Grade
20 questions
Context Clues
Quiz
•
6th Grade
Discover more resources for Mathematics
25 questions
Multiplication Facts
Quiz
•
5th Grade
15 questions
Equivalent Fractions
Quiz
•
4th Grade
12 questions
Adding and Subtracting fractions with Like denominators quiz
Quiz
•
4th Grade
16 questions
multiplication facts
Quiz
•
4th Grade
36 questions
6th Grade Math STAAR Review
Quiz
•
6th Grade
14 questions
Comparing Decimals
Quiz
•
4th Grade
15 questions
Rounding Decimals
Quiz
•
5th Grade
15 questions
Decomposing Fractions
Quiz
•
4th Grade