Understanding Picture Graphs and Data
Interactive Video
•
Mathematics, Education
•
1st - 3rd Grade
•
Practice Problem
•
Medium

Sophia Harris
Used 36+ times
FREE Resource
Read more
10 questions
Show all answers
1.
MULTIPLE CHOICE QUESTION
30 sec • 1 pt
What is the main purpose of using a picture graph?
To visualize and interpret data easily
To make data look colorful
To replace numerical data
To confuse the viewer
2.
MULTIPLE CHOICE QUESTION
30 sec • 1 pt
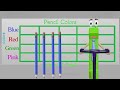
How many blue pencils are there?
Three
Four
Five
Six
3.
MULTIPLE CHOICE QUESTION
30 sec • 1 pt
What should be the title of the picture graph based on the data?
Classroom Items
Pencil Colors
Colorful Pencils
School Supplies
4.
MULTIPLE CHOICE QUESTION
30 sec • 1 pt
What does each picture in the picture graph represent?
A group of pencils
One colored pencil
A box of pencils
A classroom
5.
MULTIPLE CHOICE QUESTION
30 sec • 1 pt
How many pictures should be used to represent the red pencils?
Five
Two
Four
Three
6.
MULTIPLE CHOICE QUESTION
30 sec • 1 pt
Which color has the most pencils?
Pink
Green
Red
Blue
7.
MULTIPLE CHOICE QUESTION
30 sec • 1 pt
Are there more blue pencils or green pencils?
Not enough information
They are equal
Green pencils
Blue pencils
Access all questions and much more by creating a free account
Create resources
Host any resource
Get auto-graded reports
Continue with Google

Continue with Email
Continue with Classlink
Continue with Clever
or continue with
Microsoft
%20(1).png)
Apple
Others
Already have an account?
Popular Resources on Wayground

15 questions
Fractions on a Number Line
Quiz
•
3rd Grade
20 questions
Equivalent Fractions
Quiz
•
3rd Grade
25 questions
Multiplication Facts
Quiz
•
5th Grade
54 questions
Analyzing Line Graphs & Tables
Quiz
•
4th Grade
22 questions
fractions
Quiz
•
3rd Grade
20 questions
Main Idea and Details
Quiz
•
5th Grade
20 questions
Context Clues
Quiz
•
6th Grade
15 questions
Equivalent Fractions
Quiz
•
4th Grade
Discover more resources for Mathematics
15 questions
Fractions on a Number Line
Quiz
•
3rd Grade
20 questions
Equivalent Fractions
Quiz
•
3rd Grade
22 questions
fractions
Quiz
•
3rd Grade
18 questions
Comparing Fractions with same numerator or denominator
Quiz
•
3rd Grade
12 questions
Fractions on a numberline review
Quiz
•
3rd Grade
10 questions
Area
Quiz
•
3rd Grade
20 questions
Fractions
Quiz
•
3rd Grade
100 questions
100 multiplication facts
Quiz
•
3rd Grade