Trigonometric Functions and Sales Analysis
Interactive Video
•
Mathematics
•
9th - 12th Grade
•
Practice Problem
•
Hard
Standards-aligned

Liam Anderson
FREE Resource
Standards-aligned
Read more
10 questions
Show all answers
1.
MULTIPLE CHOICE QUESTION
30 sec • 1 pt
What is the primary focus of the video lesson introduced in the first section?
Applications of algebraic equations
Applications of geometric transformations
Applications of trigonometric equations
Applications of calculus
Tags
CCSS.6.EE.A.2C
2.
MULTIPLE CHOICE QUESTION
30 sec • 1 pt
In the calculation of October's water temperature, what value of X is used?
8
12
10
5
Tags
CCSS.6.EE.A.2C
3.
MULTIPLE CHOICE QUESTION
30 sec • 1 pt
What is the approximate water temperature in October as calculated in the video?
53 degrees Fahrenheit
43.5 degrees Fahrenheit
62.4 degrees Fahrenheit
50 degrees Fahrenheit
Tags
CCSS.HSF.TF.B.7
4.
MULTIPLE CHOICE QUESTION
30 sec • 1 pt
Which trigonometric function is isolated to find the months with a temperature of 62.4 degrees?
Secant
Cosine
Tangent
Sine
Tags
CCSS.HSF.TF.B.7
5.
MULTIPLE CHOICE QUESTION
30 sec • 1 pt
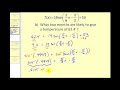
What are the two months likely to have a water temperature of 62.4 degrees?
June and July
January and February
September and October
April and August
6.
MULTIPLE CHOICE QUESTION
30 sec • 1 pt
In Raul's heating oil sales model, what is the average sales in July?
$5000
$3554.52
$3000
$4000
7.
MULTIPLE CHOICE QUESTION
30 sec • 1 pt
What method is suggested to determine the months with sales below $4000?
Manual calculation
Consulting a sales expert
Graphical analysis
Using a spreadsheet
Access all questions and much more by creating a free account
Create resources
Host any resource
Get auto-graded reports
Continue with Google

Continue with Email
Continue with Classlink
Continue with Clever
or continue with
Microsoft
%20(1).png)
Apple
Others
Already have an account?
Popular Resources on Wayground

15 questions
Fractions on a Number Line
Quiz
•
3rd Grade
20 questions
Equivalent Fractions
Quiz
•
3rd Grade
25 questions
Multiplication Facts
Quiz
•
5th Grade
29 questions
Alg. 1 Section 5.1 Coordinate Plane
Quiz
•
9th Grade
22 questions
fractions
Quiz
•
3rd Grade
11 questions
FOREST Effective communication
Lesson
•
KG
20 questions
Main Idea and Details
Quiz
•
5th Grade
20 questions
Context Clues
Quiz
•
6th Grade
Discover more resources for Mathematics
29 questions
Alg. 1 Section 5.1 Coordinate Plane
Quiz
•
9th Grade
20 questions
Graphing Inequalities on a Number Line
Quiz
•
6th - 9th Grade
20 questions
Box and Whisker Plots
Quiz
•
9th Grade
18 questions
Exponential Growth and Decay
Quiz
•
9th Grade
20 questions
Function or Not a Function
Quiz
•
8th - 9th Grade
20 questions
SSS/SAS
Quiz
•
9th - 12th Grade
14 questions
Making Inferences From Samples
Quiz
•
7th - 12th Grade
23 questions
CCG - CH8 Polygon angles and area Review
Quiz
•
9th - 12th Grade