Understanding Graphical Solutions of Inequalities
Interactive Video
•
Mathematics
•
7th - 10th Grade
•
Practice Problem
•
Hard
Standards-aligned

Aiden Montgomery
FREE Resource
Standards-aligned
Read more
10 questions
Show all answers
1.
MULTIPLE CHOICE QUESTION
30 sec • 1 pt
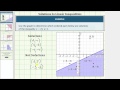
What is the inequality we are trying to solve using the graph?
x + y < 4
x - y > 4
x + 2y ≤ 4
x - 2y ≥ 4
Tags
CCSS.HSA.REI.D.12
2.
MULTIPLE CHOICE QUESTION
30 sec • 1 pt
Why is the line in the graph solid?
Because the line is not part of the solution
Because the inequality includes 'or equal to'
Because the inequality is less than
Because the inequality is strict
3.
MULTIPLE CHOICE QUESTION
30 sec • 1 pt
Which of the following ordered pairs is a solution to the inequality x - 2y ≥ 4?
(6, 5)
(-3, -3)
(2, -1)
(3, 5)
4.
MULTIPLE CHOICE QUESTION
30 sec • 1 pt
Which ordered pair is a solution for the inequality x - 2y ≥ 4?
(-3, -3)
(4, -3)
(3, 5)
(0, 0)
Tags
CCSS.HSA.REI.D.12
5.
MULTIPLE CHOICE QUESTION
30 sec • 1 pt
What does a dashed line in a graph of an inequality indicate?
The line is part of the solution
The line is not related to the inequality
The inequality is strict and does not include 'or equal to'
The inequality is less than or equal to
6.
MULTIPLE CHOICE QUESTION
30 sec • 1 pt
For the inequality x + y > 2, which of the following points is a solution?
(-1, 4)
(4, -1)
(2, 0)
(0, 2)
7.
MULTIPLE CHOICE QUESTION
30 sec • 1 pt
Which point is not a solution for the inequality x + y > 2?
(4, -1)
(4, 4)
(-1, 4)
(6, -5)
Tags
CCSS.HSA.REI.D.12
Access all questions and much more by creating a free account
Create resources
Host any resource
Get auto-graded reports
Continue with Google

Continue with Email
Continue with Classlink
Continue with Clever
or continue with
Microsoft
%20(1).png)
Apple
Others
Already have an account?
