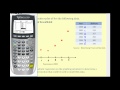
Regression Analysis and Quadratic Models
Interactive Video
•
Mathematics, Science, Business
•
9th - 12th Grade
•
Practice Problem
•
Hard

Aiden Montgomery
FREE Resource
Read more
10 questions
Show all answers
1.
MULTIPLE CHOICE QUESTION
30 sec • 1 pt
What are the main objectives of the video on quadratic regression?
To learn about linear regression
To perform quadratic regression on a TI84 calculator
To understand the history of regression analysis
To explore different types of calculators
2.
MULTIPLE CHOICE QUESTION
30 sec • 1 pt
What is the primary purpose of regression analysis?
To create complex mathematical models
To predict unknown values using known data patterns
To analyze historical data only
To determine the exact future outcomes
3.
MULTIPLE CHOICE QUESTION
30 sec • 1 pt
What is the role of R squared in regression analysis?
It measures the slope of the regression line
It determines the percentage of variation explained by the model
It calculates the average of the data points
It identifies the type of regression to use
4.
MULTIPLE CHOICE QUESTION
30 sec • 1 pt
In the example of Exxon Mobil's revenue, what is the base year represented by X = 0?
2005
2001
2000
1999
5.
MULTIPLE CHOICE QUESTION
30 sec • 1 pt
How do you enter data into the TI84 calculator for regression analysis?
By using the graph function
By entering values into L1 and L2 columns
By using the matrix function
By entering values into L3 and L4 columns
6.
MULTIPLE CHOICE QUESTION
30 sec • 1 pt
What does a high R squared value indicate about a regression model?
The model needs more data
The model is irrelevant
The model is an excellent fit
The model is not a good fit
7.
MULTIPLE CHOICE QUESTION
30 sec • 1 pt
What is the predicted revenue for Exxon Mobil in the year 2012 according to the model?
$1,800 billion
$1,200 billion
$1,645.9 billion
$1,500 billion
Access all questions and much more by creating a free account
Create resources
Host any resource
Get auto-graded reports
Continue with Google

Continue with Email
Continue with Classlink
Continue with Clever
or continue with
Microsoft
%20(1).png)
Apple
Others
Already have an account?
Popular Resources on Wayground

7 questions
History of Valentine's Day
Interactive video
•
4th Grade
15 questions
Fractions on a Number Line
Quiz
•
3rd Grade
20 questions
Equivalent Fractions
Quiz
•
3rd Grade
25 questions
Multiplication Facts
Quiz
•
5th Grade
22 questions
fractions
Quiz
•
3rd Grade
15 questions
Valentine's Day Trivia
Quiz
•
3rd Grade
20 questions
Main Idea and Details
Quiz
•
5th Grade
20 questions
Context Clues
Quiz
•
6th Grade
Discover more resources for Mathematics
20 questions
Graphing Inequalities on a Number Line
Quiz
•
6th - 9th Grade
20 questions
Exponent Properties
Quiz
•
9th Grade
15 questions
Combine Like Terms and Distributive Property
Quiz
•
8th - 9th Grade
20 questions
Function or Not a Function
Quiz
•
8th - 9th Grade
10 questions
Factor Quadratic Expressions with Various Coefficients
Quiz
•
9th - 12th Grade
10 questions
Elijah McCoy: Innovations and Impact in Black History
Interactive video
•
6th - 10th Grade
10 questions
Evaluating Piecewise Functions Practice
Quiz
•
11th Grade
21 questions
Factoring Trinomials (a=1)
Quiz
•
9th Grade