Graphing Inequalities and Linear Functions
Interactive Video
•
Mathematics
•
9th - 12th Grade
•
Practice Problem
•
Hard
Standards-aligned

Olivia Brooks
FREE Resource
Standards-aligned
Read more
10 questions
Show all answers
1.
MULTIPLE CHOICE QUESTION
30 sec • 1 pt
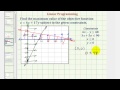
What is the objective function in this linear programming problem?
Z = 4X + 2Y
Z = 6X + 17Y
Z = 7X + 8Y
Z = 5X + 3Y
Tags
CCSS.HSA.REI.D.12
2.
MULTIPLE CHOICE QUESTION
30 sec • 1 pt
Which region is shaded when graphing y >= 0?
Below the line
Above the line
To the left of the line
To the right of the line
Tags
CCSS.HSA.REI.D.12
3.
MULTIPLE CHOICE QUESTION
30 sec • 1 pt
What type of line is used to graph x >= 0?
Dotted line
Curved line
Solid line
Dashed line
Tags
CCSS.HSA.REI.D.12
4.
MULTIPLE CHOICE QUESTION
30 sec • 1 pt
How do you determine the side to shade for the inequality 3x + 5y <= 90?
By shading neither side
By guessing
By using a test point
By shading both sides
5.
MULTIPLE CHOICE QUESTION
30 sec • 1 pt
What is the x-intercept of the line 3x + 5y = 90?
(18, 0)
(0, 18)
(30, 0)
(0, 0)
6.
MULTIPLE CHOICE QUESTION
30 sec • 1 pt
What is the y-intercept of the line 6x - y = 48?
(0, -48)
(8, 0)
(48, 0)
(0, 48)
Tags
CCSS.HSA.REI.D.12
7.
MULTIPLE CHOICE QUESTION
30 sec • 1 pt
Which point is used as a test point for shading the inequality 6x - y <= 48?
(2, 2)
(0, 0)
(1, 1)
(3, 3)
Tags
CCSS.8.EE.C.8B
CCSS.HSA.REI.C.6
Access all questions and much more by creating a free account
Create resources
Host any resource
Get auto-graded reports
Continue with Google

Continue with Email
Continue with Classlink
Continue with Clever
or continue with
Microsoft
%20(1).png)
Apple
Others
Already have an account?
Popular Resources on Wayground

15 questions
Fractions on a Number Line
Quiz
•
3rd Grade
20 questions
Equivalent Fractions
Quiz
•
3rd Grade
25 questions
Multiplication Facts
Quiz
•
5th Grade
54 questions
Analyzing Line Graphs & Tables
Quiz
•
4th Grade
22 questions
fractions
Quiz
•
3rd Grade
20 questions
Main Idea and Details
Quiz
•
5th Grade
20 questions
Context Clues
Quiz
•
6th Grade
15 questions
Equivalent Fractions
Quiz
•
4th Grade
Discover more resources for Mathematics
20 questions
Graphing Inequalities on a Number Line
Quiz
•
6th - 9th Grade
18 questions
SAT Prep: Ratios, Proportions, & Percents
Quiz
•
9th - 10th Grade
12 questions
Exponential Growth and Decay
Quiz
•
9th Grade
12 questions
Parallel Lines Cut by a Transversal
Quiz
•
10th Grade
12 questions
Add and Subtract Polynomials
Quiz
•
9th - 12th Grade
15 questions
Combine Like Terms and Distributive Property
Quiz
•
8th - 9th Grade
20 questions
Function or Not a Function
Quiz
•
8th - 9th Grade
10 questions
Elijah McCoy: Innovations and Impact in Black History
Interactive video
•
6th - 10th Grade