Representing solutions of linear inequalities in two variables on a graph
Authored by Wayground Content
Mathematics
9th - 12th Grade
CCSS covered
Used 2+ times

AI Actions
Add similar questions
Adjust reading levels
Convert to real-world scenario
Translate activity
More...
Content View
Student View
20 questions
Show all answers
1.
MULTIPLE SELECT QUESTION
30 sec • 1 pt
When graphing , you will draw which of the following.
A dotted line
A solid line
Shade above
Shade below
Tags
CCSS.HSA.REI.D.12
2.
MULTIPLE CHOICE QUESTION
1 min • 1 pt

Select the graph for y ≥ -3.
Tags
CCSS.HSA.REI.D.12
3.
MULTIPLE CHOICE QUESTION
30 sec • 1 pt
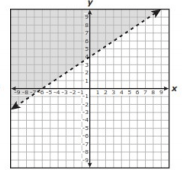
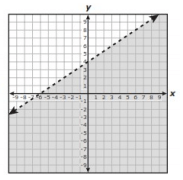
Which graph best represents the inequality -2x + 3y > 12
Tags
CCSS.HSA.REI.D.12
4.
MULTIPLE CHOICE QUESTION
30 sec • 1 pt
Based on the inequality, should the line be dotted or solid? 12x - 8y < 24
dotted
solid
Tags
CCSS.HSA.REI.D.12
5.
MULTIPLE CHOICE QUESTION
3 mins • 1 pt

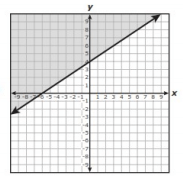
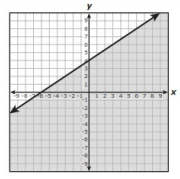
Which inequality is graphed here?
y > -1x + 5
y < -1x - 5
y > -1x - 5
y < -1x + 5
Tags
CCSS.HSA.REI.D.12
6.
MULTIPLE CHOICE QUESTION
30 sec • 1 pt
When a linear inequality uses a symbol either > or <, the line that you'll graph would be?
Dotted/Dashed line (Broken line)
Solid line
Tags
CCSS.HSA.REI.D.12
7.
MULTIPLE CHOICE QUESTION
15 mins • 1 pt

Select the correct graph for each inequality.
Tags
CCSS.HSA.REI.D.12


Access all questions and much more by creating a free account
Create resources
Host any resource
Get auto-graded reports
Continue with Google

Continue with Email
Continue with Classlink
Continue with Clever
or continue with
Microsoft
%20(1).png)
Apple
Others
Already have an account?
