
Understanding Exponential Growth Graphs
Quiz
•
Mathematics
•
8th Grade
•
Practice Problem
•
Hard

Jayden le
FREE Resource
Student preview

15 questions
Show all answers
1.
MULTIPLE CHOICE QUESTION
30 sec • 1 pt

The number of stores opened by a coffee company can be modeled by the exponential function graphed on the grid, where x is the number of years since 1992. Based on the graph, which statement does NOT appear to be true?
The coffee company had opened 400 stores by the end of 1992.
The coffee company opened 100 stores in one year.
Every year the number of stores the coffee company opened increased by 25%.
Since 1992 the coffee company has opened 250 stores each year.
2.
MULTIPLE CHOICE QUESTION
30 sec • 1 pt

Choose the correct graph for the situation for problem #4.


3.
MULTIPLE CHOICE QUESTION
30 sec • 1 pt

Choose the correct graph for the problem situation #2.


4.
MULTIPLE CHOICE QUESTION
30 sec • 1 pt
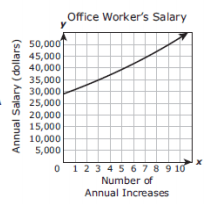
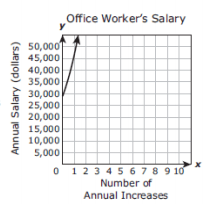
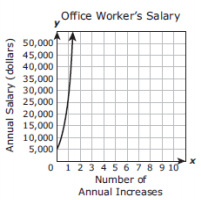
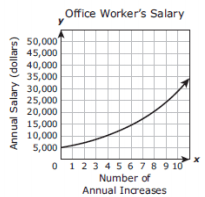
The starting annual salary for an office worker at a company is $29,000. If the company awards an annual increase of 6.2%, which graph models this situation after the office worker receives x annual increases ?
5.
MULTIPLE CHOICE QUESTION
30 sec • 1 pt
Which graph best models the situation where the initial value of a home is $200,000 and the value of the home increases at a rate of 6% each year?


6.
MULTIPLE CHOICE QUESTION
30 sec • 1 pt

The starting annual salary for an office worker at a company is $29,000. If the company awards an annual increase of 6.2%, which graph models this situation after the office worker receives x annual increases?


7.
MULTIPLE CHOICE QUESTION
30 sec • 1 pt

The number of stores opened by a coffee company can be modeled by the exponential function graphed on the grid, where x is the number of years since 1992. Based on the graph, which statement does NOT appear to be true?
The coffee company had opened 400 stores by the end of 1992.
The coffee company opened 100 stores in one year.
Every year the number of stores the coffee company opened increased by 25%.
Since 1992 the coffee company has opened 250 stores each year.
Access all questions and much more by creating a free account
Create resources
Host any resource
Get auto-graded reports
Continue with Google

Continue with Email
Continue with Classlink
Continue with Clever
or continue with
Microsoft
%20(1).png)
Apple
Others
Already have an account?
Popular Resources on Wayground

15 questions
Fractions on a Number Line
Quiz
•
3rd Grade
20 questions
Equivalent Fractions
Quiz
•
3rd Grade
25 questions
Multiplication Facts
Quiz
•
5th Grade
54 questions
Analyzing Line Graphs & Tables
Quiz
•
4th Grade
22 questions
fractions
Quiz
•
3rd Grade
20 questions
Main Idea and Details
Quiz
•
5th Grade
20 questions
Context Clues
Quiz
•
6th Grade
15 questions
Equivalent Fractions
Quiz
•
4th Grade
Discover more resources for Mathematics
14 questions
finding slope from a graph
Quiz
•
8th Grade
20 questions
Laws of Exponents
Quiz
•
8th Grade
12 questions
8th U5L9 Linear Models
Quiz
•
8th Grade
20 questions
Graphing Inequalities on a Number Line
Quiz
•
6th - 9th Grade
20 questions
Volume of cylinders, Cones and Spheres
Quiz
•
8th Grade
20 questions
One Step equations addition and subtraction
Quiz
•
5th - 8th Grade
20 questions
Mean, Median, Mode, and Range
Quiz
•
8th Grade
15 questions
Volume of a Cylinder
Quiz
•
8th Grade