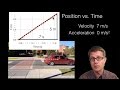
Analyzing Motion with Graphs
Interactive Video
•
Physics, Science
•
10th - 12th Grade
•
Practice Problem
•
Medium

Lucas Foster
Used 6+ times
FREE Resource
Read more
10 questions
Show all answers
1.
MULTIPLE CHOICE QUESTION
30 sec • 1 pt
What happens to your position and velocity when you jump out of an airplane?
Position becomes more negative, velocity decreases
Position remains constant, velocity decreases
Position becomes more negative, velocity increases
Position becomes more positive, velocity decreases
2.
MULTIPLE CHOICE QUESTION
30 sec • 1 pt
How is velocity calculated from displacement and time?
Velocity is displacement multiplied by time
Velocity is displacement divided by time
Velocity is time divided by displacement
Velocity is the square of displacement divided by time
3.
MULTIPLE CHOICE QUESTION
30 sec • 1 pt
What does a straight horizontal line on a position vs. time graph indicate?
The object is moving in the negative direction
The object is not moving
The object is moving with constant velocity
The object is accelerating
4.
MULTIPLE CHOICE QUESTION
30 sec • 1 pt
What does a positive slope on a position vs. time graph represent?
The object is stationary
The object is moving to the right
The object is moving to the left
The object is accelerating
5.
MULTIPLE CHOICE QUESTION
30 sec • 1 pt
How can you determine the velocity of an object from a position vs. time graph?
By measuring the distance between two points
By measuring the area under the curve
By calculating the slope of the line
By finding the y-intercept
6.
MULTIPLE CHOICE QUESTION
30 sec • 1 pt
What does a curved line on a position vs. time graph indicate?
The object is stationary
The object is decelerating
The object is accelerating
The object is moving with constant velocity
7.
MULTIPLE CHOICE QUESTION
30 sec • 1 pt
In the video analysis example, what was the acceleration of the basketball?
-5 m/s²
10 m/s²
-10 m/s²
0 m/s²
Access all questions and much more by creating a free account
Create resources
Host any resource
Get auto-graded reports
Continue with Google

Continue with Email
Continue with Classlink
Continue with Clever
or continue with
Microsoft
%20(1).png)
Apple
Others
Already have an account?
Popular Resources on Wayground

15 questions
Fractions on a Number Line
Quiz
•
3rd Grade
20 questions
Equivalent Fractions
Quiz
•
3rd Grade
25 questions
Multiplication Facts
Quiz
•
5th Grade
22 questions
fractions
Quiz
•
3rd Grade
20 questions
Main Idea and Details
Quiz
•
5th Grade
20 questions
Context Clues
Quiz
•
6th Grade
15 questions
Equivalent Fractions
Quiz
•
4th Grade
20 questions
Figurative Language Review
Quiz
•
6th Grade
Discover more resources for Physics
18 questions
Universal Law of Gravitation
Lesson
•
11th Grade
20 questions
Potential and Kinetic Energy
Quiz
•
9th - 12th Grade
34 questions
Energy Review
Quiz
•
9th - 12th Grade
14 questions
Bill Nye Waves
Interactive video
•
9th - 12th Grade
24 questions
Reflection, Refraction & Diffraction
Quiz
•
6th - 12th Grade
14 questions
Work and Energy intro
Interactive video
•
8th - 10th Grade