Understanding Linear and Exponential Models
Interactive Video
•
Mathematics
•
7th - 10th Grade
•
Practice Problem
•
Hard
Standards-aligned

Sophia Harris
FREE Resource
Standards-aligned
Read more
10 questions
Show all answers
1.
MULTIPLE CHOICE QUESTION
30 sec • 1 pt
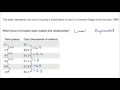
What is the main problem being addressed in the video?
Calculating the exact cost of land
Understanding the history of land prices
Modeling the cost of land using a function
Choosing between different types of land
Tags
CCSS.HSF-LE.A.1B
2.
MULTIPLE CHOICE QUESTION
30 sec • 1 pt
What does a constant change in time suggest in a linear model?
A decrease in cost
An exponential increase in cost
A variable change in cost
A constant change in cost
Tags
CCSS.HSF-LE.A.1B
3.
MULTIPLE CHOICE QUESTION
30 sec • 1 pt
How much does the cost increase from 30 to 36.9?
7.2
6.8
6.9
7.0
4.
MULTIPLE CHOICE QUESTION
30 sec • 1 pt
Why is the data not exactly linear?
Because it is from a real-world situation
Because it is calculated incorrectly
Because it is an exponential model
Because it is a quadratic model
Tags
CCSS.HSF-IF.C.8B
5.
MULTIPLE CHOICE QUESTION
30 sec • 1 pt
What factor is not consistent in an exponential model?
The addition factor
The multiplication factor
The subtraction factor
The time increment
6.
MULTIPLE CHOICE QUESTION
30 sec • 1 pt
What does the analysis suggest about the model?
It is definitely exponential
It is a quadratic model
It is neither linear nor exponential
It is likely linear
Tags
CCSS.HSF-IF.C.8B
7.
MULTIPLE CHOICE QUESTION
30 sec • 1 pt
What happens to the multiplication factor in an exponential model as costs increase?
It remains constant
It increases
It decreases
It becomes zero
Access all questions and much more by creating a free account
Create resources
Host any resource
Get auto-graded reports
Continue with Google

Continue with Email
Continue with Classlink
Continue with Clever
or continue with
Microsoft
%20(1).png)
Apple
Others
Already have an account?
Popular Resources on Wayground

15 questions
Fractions on a Number Line
Quiz
•
3rd Grade
20 questions
Equivalent Fractions
Quiz
•
3rd Grade
25 questions
Multiplication Facts
Quiz
•
5th Grade
54 questions
Analyzing Line Graphs & Tables
Quiz
•
4th Grade
22 questions
fractions
Quiz
•
3rd Grade
20 questions
Main Idea and Details
Quiz
•
5th Grade
20 questions
Context Clues
Quiz
•
6th Grade
15 questions
Equivalent Fractions
Quiz
•
4th Grade
Discover more resources for Mathematics
22 questions
distributive property
Quiz
•
7th Grade
18 questions
Angle Relationships
Quiz
•
7th Grade
20 questions
How Some Friendships Last — and Others Don’t Video Questions
Quiz
•
7th Grade
14 questions
finding slope from a graph
Quiz
•
8th Grade
18 questions
Handbook Refresher Quiz
Quiz
•
7th Grade
20 questions
Laws of Exponents
Quiz
•
8th Grade
12 questions
8th U5L9 Linear Models
Quiz
•
8th Grade
20 questions
Graphing Inequalities on a Number Line
Quiz
•
6th - 9th Grade