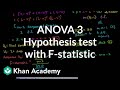
Understanding Variations and Hypothesis Testing
Interactive Video
•
Mathematics, Science, Biology
•
10th - 12th Grade
•
Practice Problem
•
Hard

Amelia Wright
FREE Resource
Read more
10 questions
Show all answers
1.
MULTIPLE CHOICE QUESTION
30 sec • 1 pt
What is the Total Sum of Squares in the given data points?
24
30
6
12
2.
MULTIPLE CHOICE QUESTION
30 sec • 1 pt
In the context of the experiment, what is being tested?
The effect of different foods on test scores
The effect of different exercises on health
The impact of sleep on productivity
The influence of music on concentration
3.
MULTIPLE CHOICE QUESTION
30 sec • 1 pt
What is the null hypothesis in the context of the experiment?
The means of the groups are the same
The means of the groups are random
The means of the groups are different
The means of the groups are unknown
4.
MULTIPLE CHOICE QUESTION
30 sec • 1 pt
What does a high F statistic indicate?
Low variation within groups
Low variation between groups
High variation between groups
High variation within groups
5.
MULTIPLE CHOICE QUESTION
30 sec • 1 pt
What is the F statistic a ratio of?
Two binomial distributions
Two Chi-squared distributions
Two t-distributions
Two normal distributions
6.
MULTIPLE CHOICE QUESTION
30 sec • 1 pt
What does the F statistic help determine in hypothesis testing?
The likelihood of the null hypothesis being true
The likelihood of the population mean being accurate
The likelihood of the alternate hypothesis being true
The likelihood of the sample mean being accurate
7.
MULTIPLE CHOICE QUESTION
30 sec • 1 pt
What is the significance level used in the hypothesis test?
20%
15%
10%
5%
Access all questions and much more by creating a free account
Create resources
Host any resource
Get auto-graded reports
Continue with Google

Continue with Email
Continue with Classlink
Continue with Clever
or continue with
Microsoft
%20(1).png)
Apple
Others
Already have an account?
Popular Resources on Wayground

15 questions
Fractions on a Number Line
Quiz
•
3rd Grade
20 questions
Equivalent Fractions
Quiz
•
3rd Grade
25 questions
Multiplication Facts
Quiz
•
5th Grade
54 questions
Analyzing Line Graphs & Tables
Quiz
•
4th Grade
22 questions
fractions
Quiz
•
3rd Grade
20 questions
Main Idea and Details
Quiz
•
5th Grade
20 questions
Context Clues
Quiz
•
6th Grade
15 questions
Equivalent Fractions
Quiz
•
4th Grade
Discover more resources for Mathematics
18 questions
SAT Prep: Ratios, Proportions, & Percents
Quiz
•
9th - 10th Grade
12 questions
Parallel Lines Cut by a Transversal
Quiz
•
10th Grade
12 questions
Add and Subtract Polynomials
Quiz
•
9th - 12th Grade
10 questions
Elijah McCoy: Innovations and Impact in Black History
Interactive video
•
6th - 10th Grade
16 questions
Converting Improper Fractions to Mixed Numbers
Quiz
•
4th - 10th Grade
15 questions
Intro to Trig Ratios
Quiz
•
10th Grade
10 questions
Solving One Step Equations: Key Concepts and Techniques
Interactive video
•
6th - 10th Grade
12 questions
Triangle Inequality Theorem
Quiz
•
10th Grade