Understanding Statistics and Parameters
Interactive Video
•
Mathematics, Science
•
7th - 10th Grade
•
Practice Problem
•
Medium

Amelia Wright
Used 7+ times
FREE Resource
Read more
10 questions
Show all answers
1.
MULTIPLE CHOICE QUESTION
30 sec • 1 pt
What is the main difference between a statistic and a parameter?
A statistic describes a sample, while a parameter describes a population.
A statistic describes a population, while a parameter describes a sample.
Both statistic and parameter describe a sample.
Both statistic and parameter describe a population.
2.
MULTIPLE CHOICE QUESTION
30 sec • 1 pt
In the example of town XYZ, what does the sample mean represent?
The average age of a subset of residents in town XYZ.
The total number of residents in town XYZ.
The average age of all residents in town XYZ.
The total number of samples taken in town XYZ.
3.
MULTIPLE CHOICE QUESTION
30 sec • 1 pt
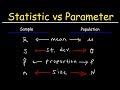
Which symbol represents the mean of a population?
S
x-bar
P hat
mu
4.
MULTIPLE CHOICE QUESTION
30 sec • 1 pt
What does the symbol 'S' stand for in statistics?
Population mean
Population standard deviation
Sample standard deviation
Sample mean
5.
MULTIPLE CHOICE QUESTION
30 sec • 1 pt
What is the symbol for the sample proportion?
P hat
P
n
N
6.
MULTIPLE CHOICE QUESTION
30 sec • 1 pt
How is the size of a sample represented in statistics?
Capital N
Lowercase n
P hat
Sigma
7.
MULTIPLE CHOICE QUESTION
30 sec • 1 pt
If you calculate the average height of 100 cats in California, what is this an example of?
A population mean
A statistic
A parameter
A population variance
Access all questions and much more by creating a free account
Create resources
Host any resource
Get auto-graded reports
Continue with Google

Continue with Email
Continue with Classlink
Continue with Clever
or continue with
Microsoft
%20(1).png)
Apple
Others
Already have an account?
Similar Resources on Wayground

6 questions
Shia and Sunni Islam
Interactive video
•
6th - 9th Grade
9 questions
Collaborative Teaching Strategies in Math
Interactive video
•
9th - 10th Grade
6 questions
Using Graphs to Persuade: Measures of Center and Variability
Interactive video
•
9th - 10th Grade
8 questions
Searching for Mysis Shrimp - Field Trip
Interactive video
•
6th - 9th Grade
11 questions
Sample Proportions and Expected Values
Interactive video
•
9th - 10th Grade
Popular Resources on Wayground
15 questions
Fractions on a Number Line
Quiz
•
3rd Grade
20 questions
Equivalent Fractions
Quiz
•
3rd Grade
25 questions
Multiplication Facts
Quiz
•
5th Grade
54 questions
Analyzing Line Graphs & Tables
Quiz
•
4th Grade
22 questions
fractions
Quiz
•
3rd Grade
20 questions
Main Idea and Details
Quiz
•
5th Grade
20 questions
Context Clues
Quiz
•
6th Grade
15 questions
Equivalent Fractions
Quiz
•
4th Grade
Discover more resources for Mathematics
22 questions
distributive property
Quiz
•
7th Grade
18 questions
Angle Relationships
Quiz
•
7th Grade
20 questions
How Some Friendships Last — and Others Don’t Video Questions
Quiz
•
7th Grade
14 questions
finding slope from a graph
Quiz
•
8th Grade
18 questions
Handbook Refresher Quiz
Quiz
•
7th Grade
20 questions
Laws of Exponents
Quiz
•
8th Grade
12 questions
8th U5L9 Linear Models
Quiz
•
8th Grade
20 questions
Graphing Inequalities on a Number Line
Quiz
•
6th - 9th Grade