untitled
Authored by Rebecca Halliburton
Mathematics
8th Grade
CCSS covered
Used 1+ times

AI Actions
Add similar questions
Adjust reading levels
Convert to real-world scenario
Translate activity
More...
Content View
Student View
28 questions
Show all answers
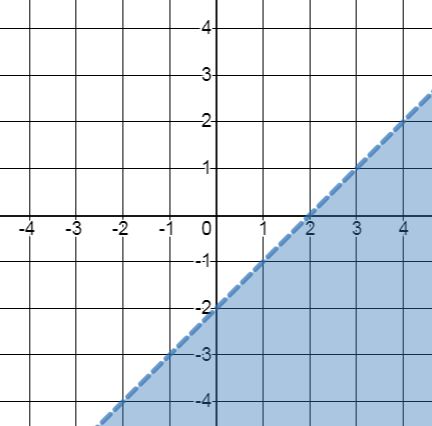
1.
MULTIPLE CHOICE QUESTION
15 mins • 3 pts

Write the inequality for the graph.
Tags
CCSS.HSA.REI.D.12
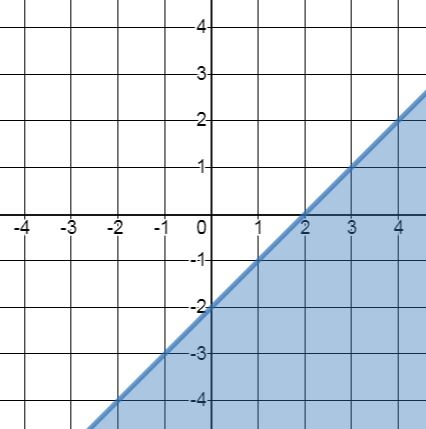
2.
MULTIPLE CHOICE QUESTION
15 mins • 3 pts

Write the inequality for the graph.
Tags
CCSS.HSA.REI.D.12
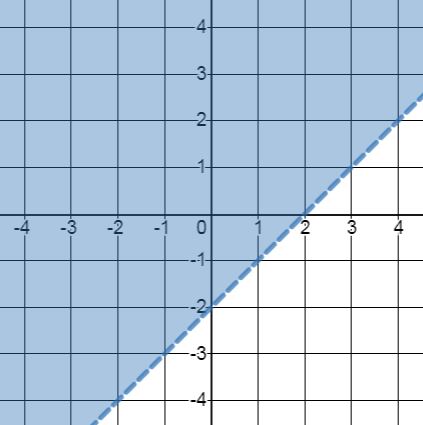
3.
MULTIPLE CHOICE QUESTION
15 mins • 3 pts

Write the inequality for the graph.
Tags
CCSS.HSA.REI.D.12
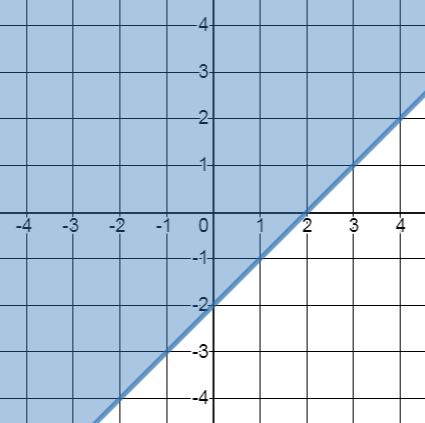
4.
MULTIPLE CHOICE QUESTION
15 mins • 3 pts

Write the inequality for the graph.
Tags
CCSS.6.EE.B.8
5.
MULTIPLE CHOICE QUESTION
15 mins • 3 pts
Identify the graph for the linear inequality
Tags
CCSS.HSA.REI.D.12
6.
MULTIPLE CHOICE QUESTION
15 mins • 5 pts
How can I tell if an inequality will have a solid line?
Tags
CCSS.HSA.REI.D.12
7.
MULTIPLE CHOICE QUESTION
15 mins • 3 pts

Which graph best represents the following inequality?


Tags
CCSS.HSA.REI.D.12


Access all questions and much more by creating a free account
Create resources
Host any resource
Get auto-graded reports
Continue with Google

Continue with Email
Continue with Microsoft
or continue with

%20(1).png)
Apple
Others
Already have an account?
